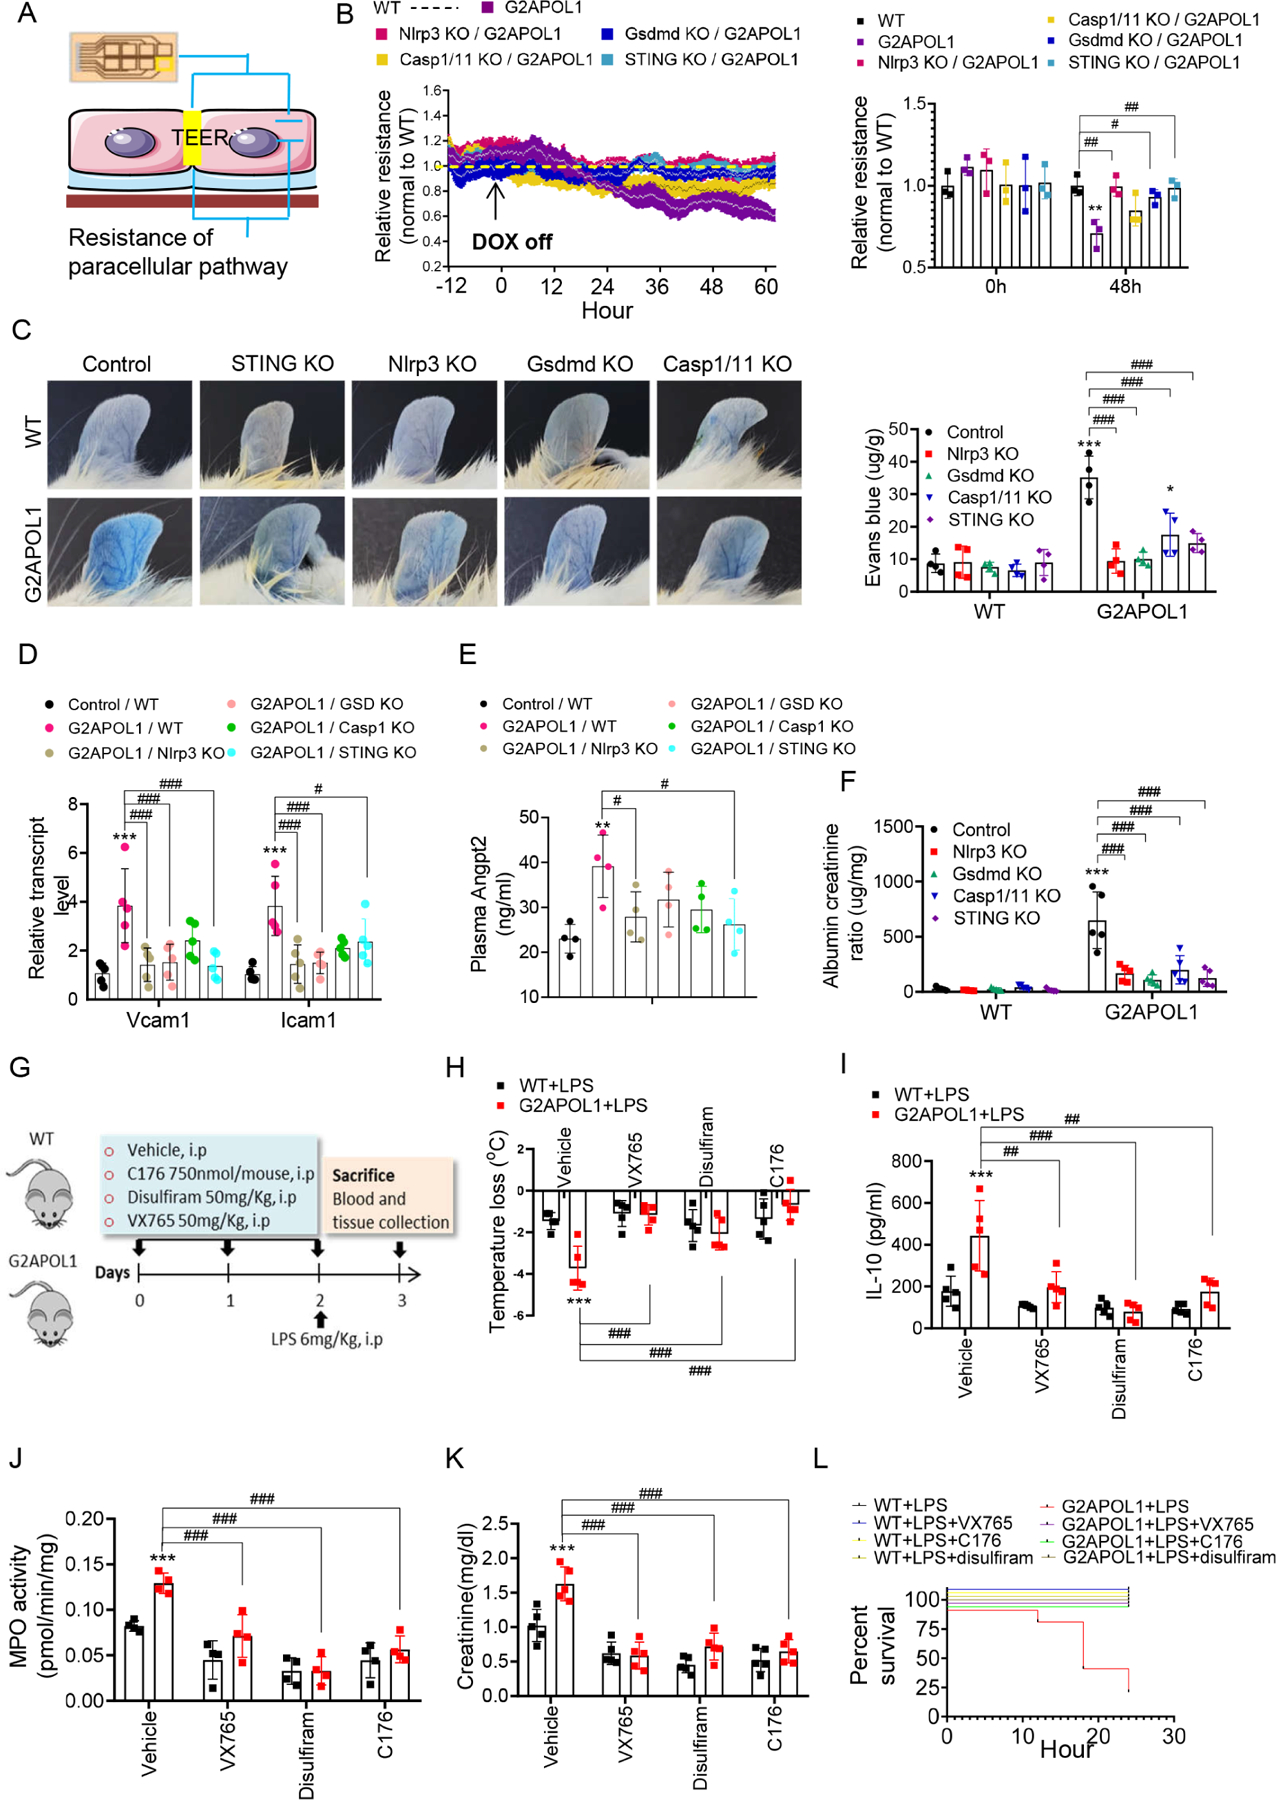
Figure 7. Genetic targeting of the NLRP3 and STING ameliorated endothelial RV APOL1 induced endotheliopathy and sepsis with pharmacological therapeutic potential.

A. TEER: Trans-endothelial electrical resistance measurement of endothelial function
B. (Left panel) TEER measured in real time in ECs from WT, EC/G2APOL1, Nlrp3−/−/G2APOL1, Gsdmd−/− /G2APOL1, Casp 1/11−/−/G2APOL1 and STING−/−/G2APOL1 mice. At each individual time point, TEER values were normalized to WT ECs. (Right panel) Relative TEER at 0 hr and 48 hr after removal of DOX. **p<0.01 vs. WT; #p < 0.05, ##p < 0.01 vs. indicated group.
C. Representative photographs of Evan’s blue dye leakage in ears. (Right panel) Spectrophotometric analysis of the amount of extravasated Evans blue dye from mouse ears. *p<0.05, **p<0.01 vs. WT; ###p < 0.001 vs. indicated group.
D. Relative mRNA levels of Vcam1 and Icam1 in indicated groups. ***p<0.001 vs. WT; #p < 0.05, ###p < 0.001 vs. indicated group.
E. Plasma Angpt2 level in indicated groups. **p<0.01 vs. WT; #p < 0.05 vs. indicated group.
F. Urinary albumin/creatinine ratio (ACR) of indicated groups at 10 weeks off doxcycyline diet. ***p<0.001 vs. WT; ###p < 0.001 vs. indicated group.
G. Experimental design: Pharmacological targeting of the inflammasome and nucleotide sensing pathways in WT and EC/G2APOL1 mice.
H. Body temperature response to saline or LPS at 12h in group as shown in Panel (G).
I. Serum IL10 of mice as shown in Panel (G) 24h after saline or LPS injection; ***p<0.001 vs WT+LPS; ##p < 0.01, ###p < 0.001 vs. indicated group.
J. MPO activity was measured in the lung obtained 24 hr after the administration of saline or LPS in in group as shown in Panel G; **p<0.01, ***p<0.001 vs WT+LPS; ##p < 0.01 vs. indicated groups
K. Renal function of mice as shown in Panel G at 24h after saline or LPS injection, assessed by creatinine. ***p<0.001 vs WT+LPS; ###p < 0.001 vs. indicated group.
L. Survival after intraperitoneal injection of LPS (6mg/kg) in group as shown in Panel G.
