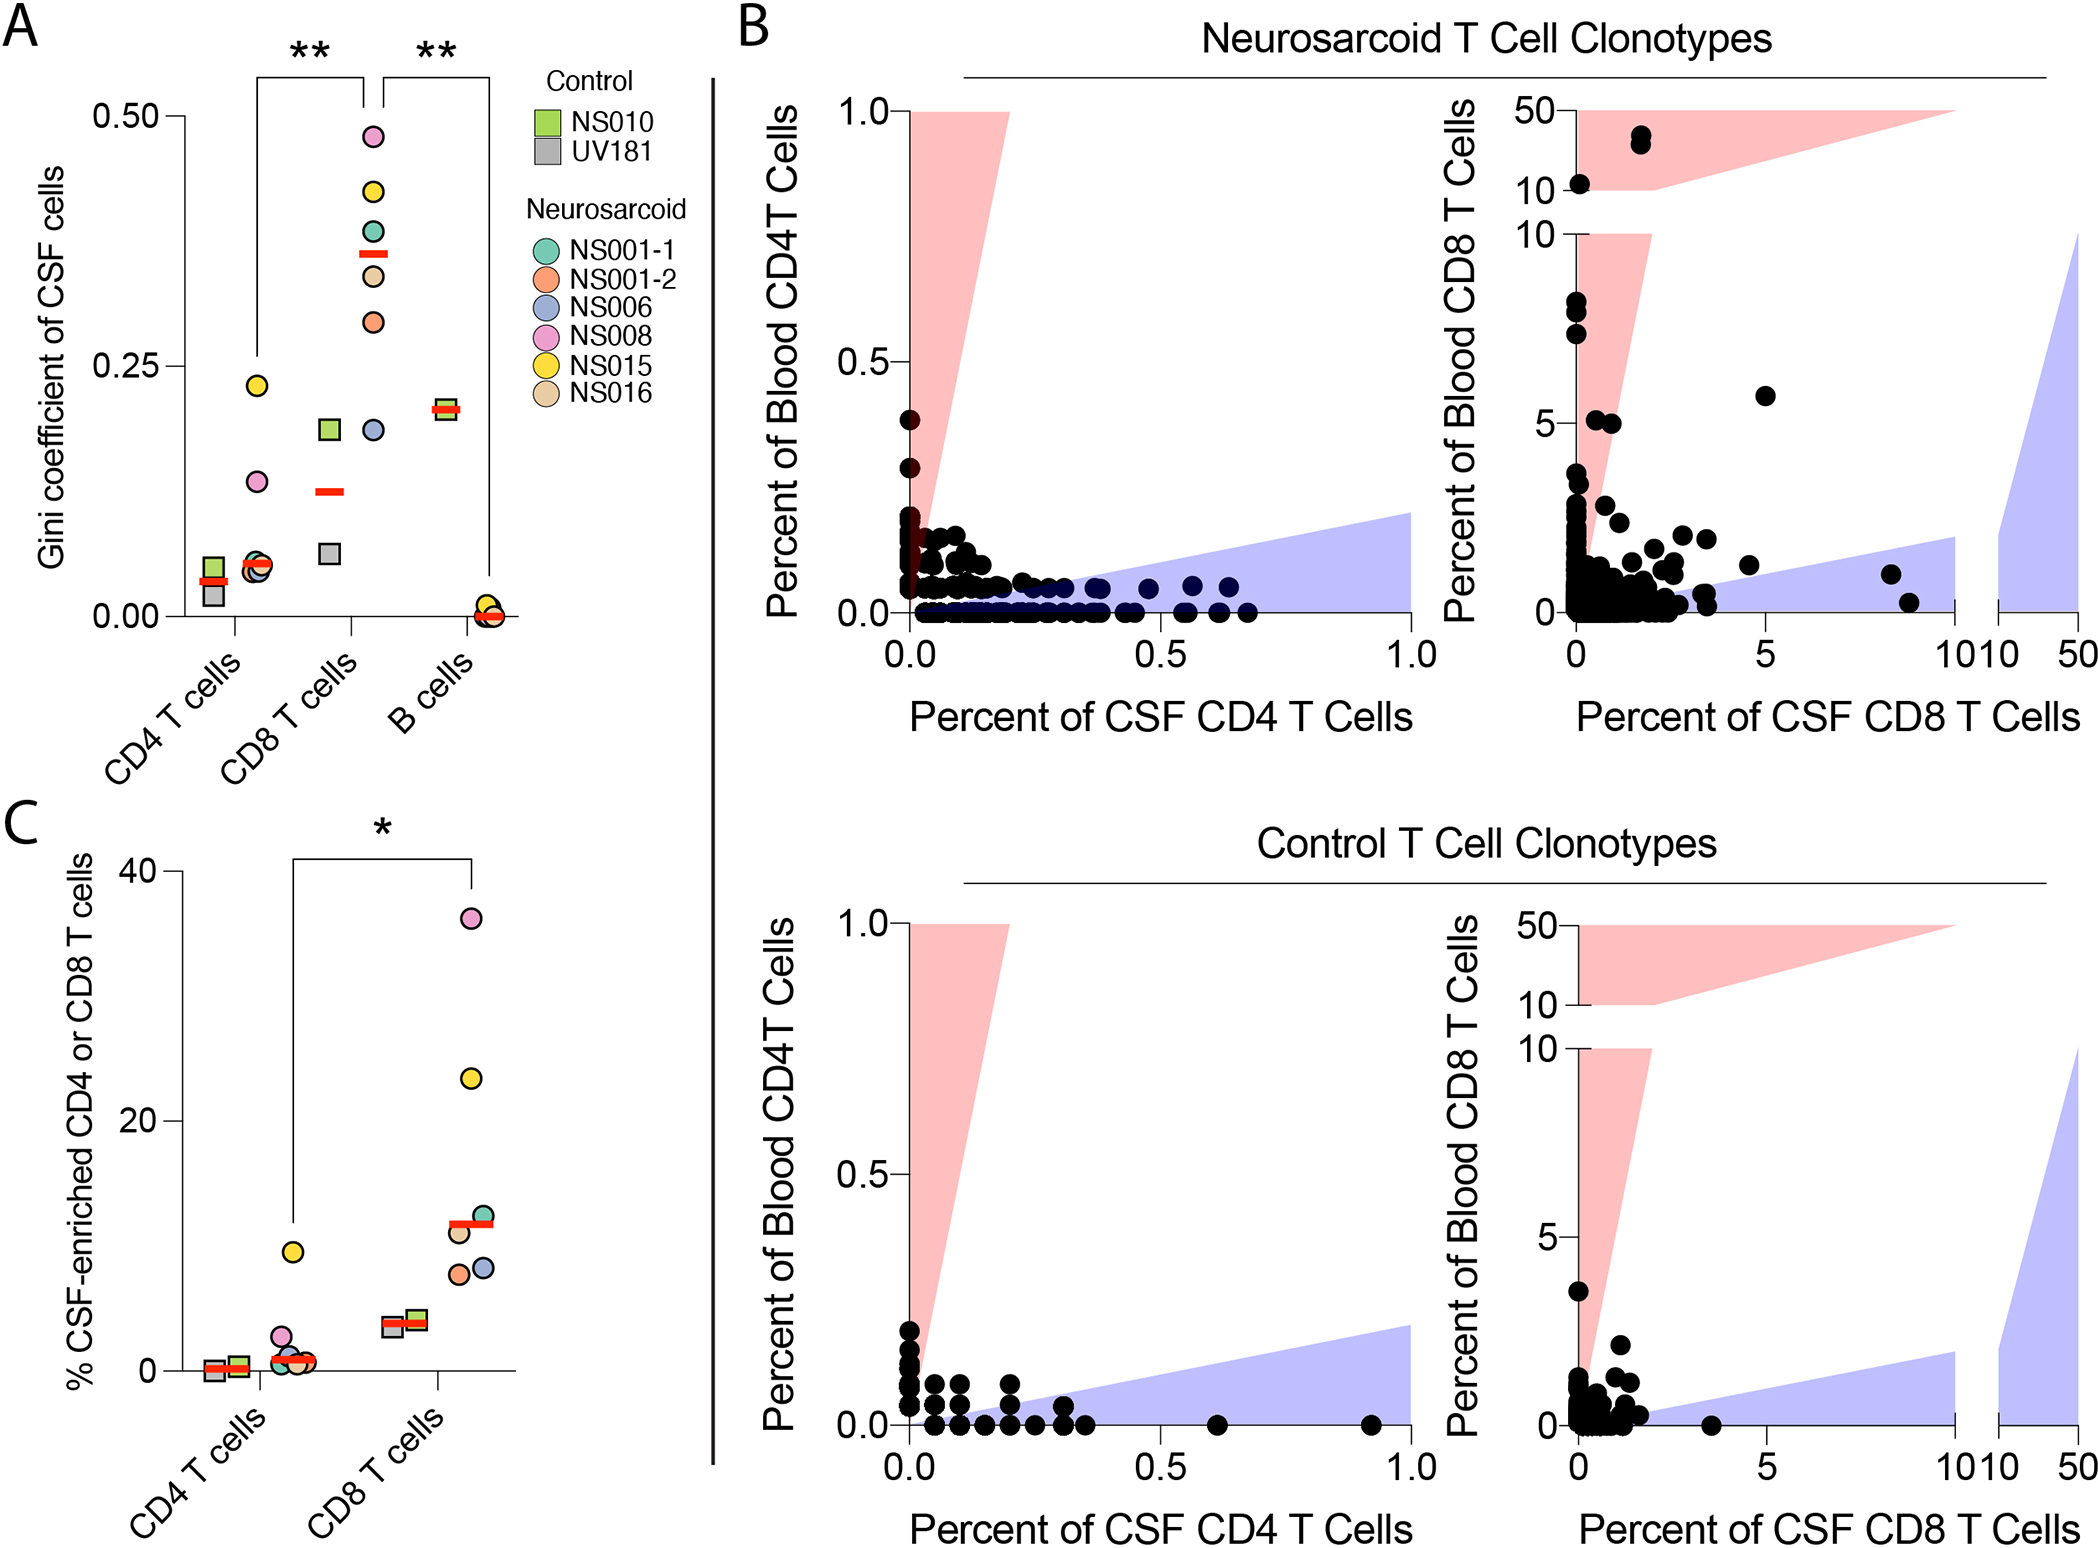
Figure 2. Clonal expansion and CSF-enrichment are seen in CD8 T cells in neurosarcoid.

(A) Diversity and clonality of indicated lymphocyte lineages within the CSF as measured by the Gini coefficient, where on a scale from 0 to 1, 0 indicates all clonotypes have the same frequency and 1 indicates a monoclonal population. (B) Frequency of CD4 (left) and CD8 (right) T cell clonotypes in the blood and CSF for neurosarcoid (top) and control (bottom) participants. Each dot represents a single clonotype defined by V-gene segments and CDR3 amino-acid sequences for both alpha and beta chains. Red and blue shading indicates clonotypes with a 5-fold increase in frequency in one tissue over the other, either blood (red) or CSF (blue). (C) Percent of CSF-enriched CD4 or CD8 T cells for neurosarcoid and control participants. A CSF-enriched cell has a clonotype with at least 5 cells in the CSF and a 5-fold increased frequency in the CSF over the blood. * p < 0.05; ** p < 0.01, 2-way ANOVA followed by Sidak’s multiple comparisons test.
