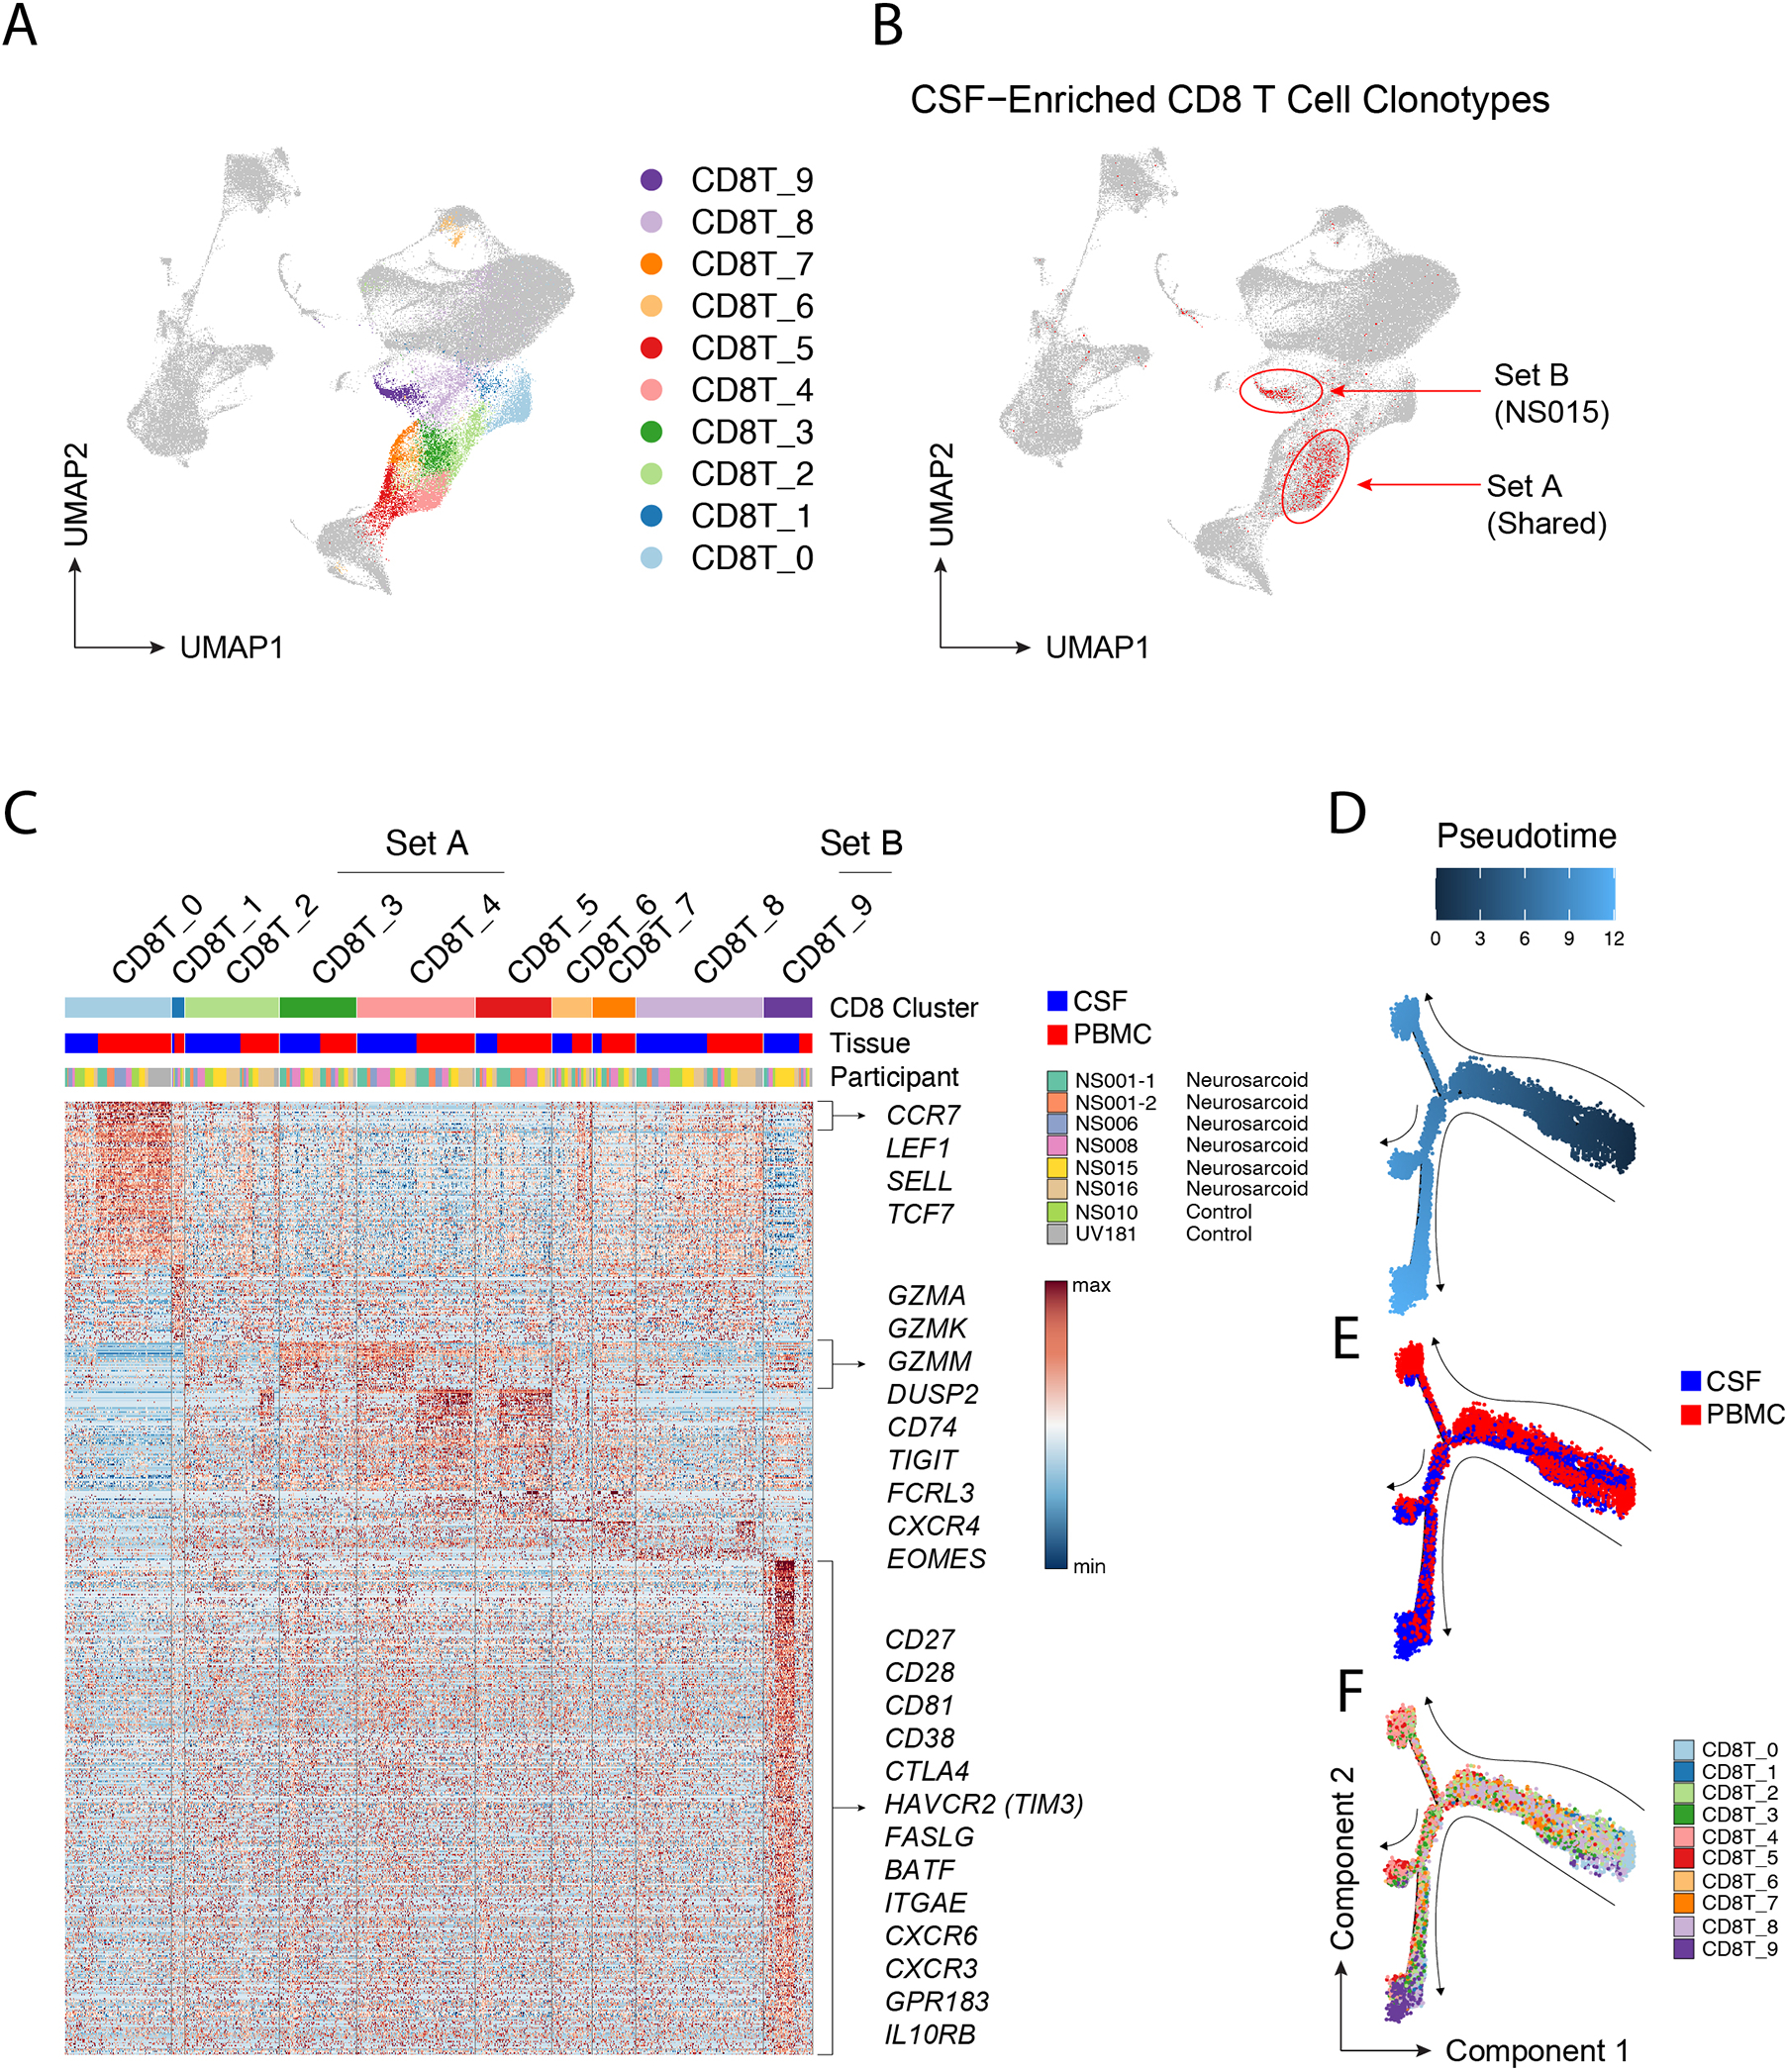
Figure 3. CSF-enriched CD8 T cell clonotypes have a shared transcriptional signature.

(A) Ten CD8 T cell clusters are highlighted on UMAP visualization. (B) Mapping of CSF-enriched CD8 T cell clonotypes (highlighted in red) to clusters 3, 4 and 9 on UMAP. Whether the CSF-enriched CD8 T cell clonotypes are from multiple participants (Set A) or predominantly a single participant (NS015; Set B) is annotated. (C) Heatmap of genes upregulated in each CD8 T cell cluster. Each column is cell annotated by cluster, tissue, and participant. Genes upregulated in CD8 T cells from the CSF in clusters 3, 4, and 9 are annotated. (D-F) Lineage trajectory of CD8 T cells colored by (D) pseudotime, (E) tissue, or (F) CD8 cluster.
