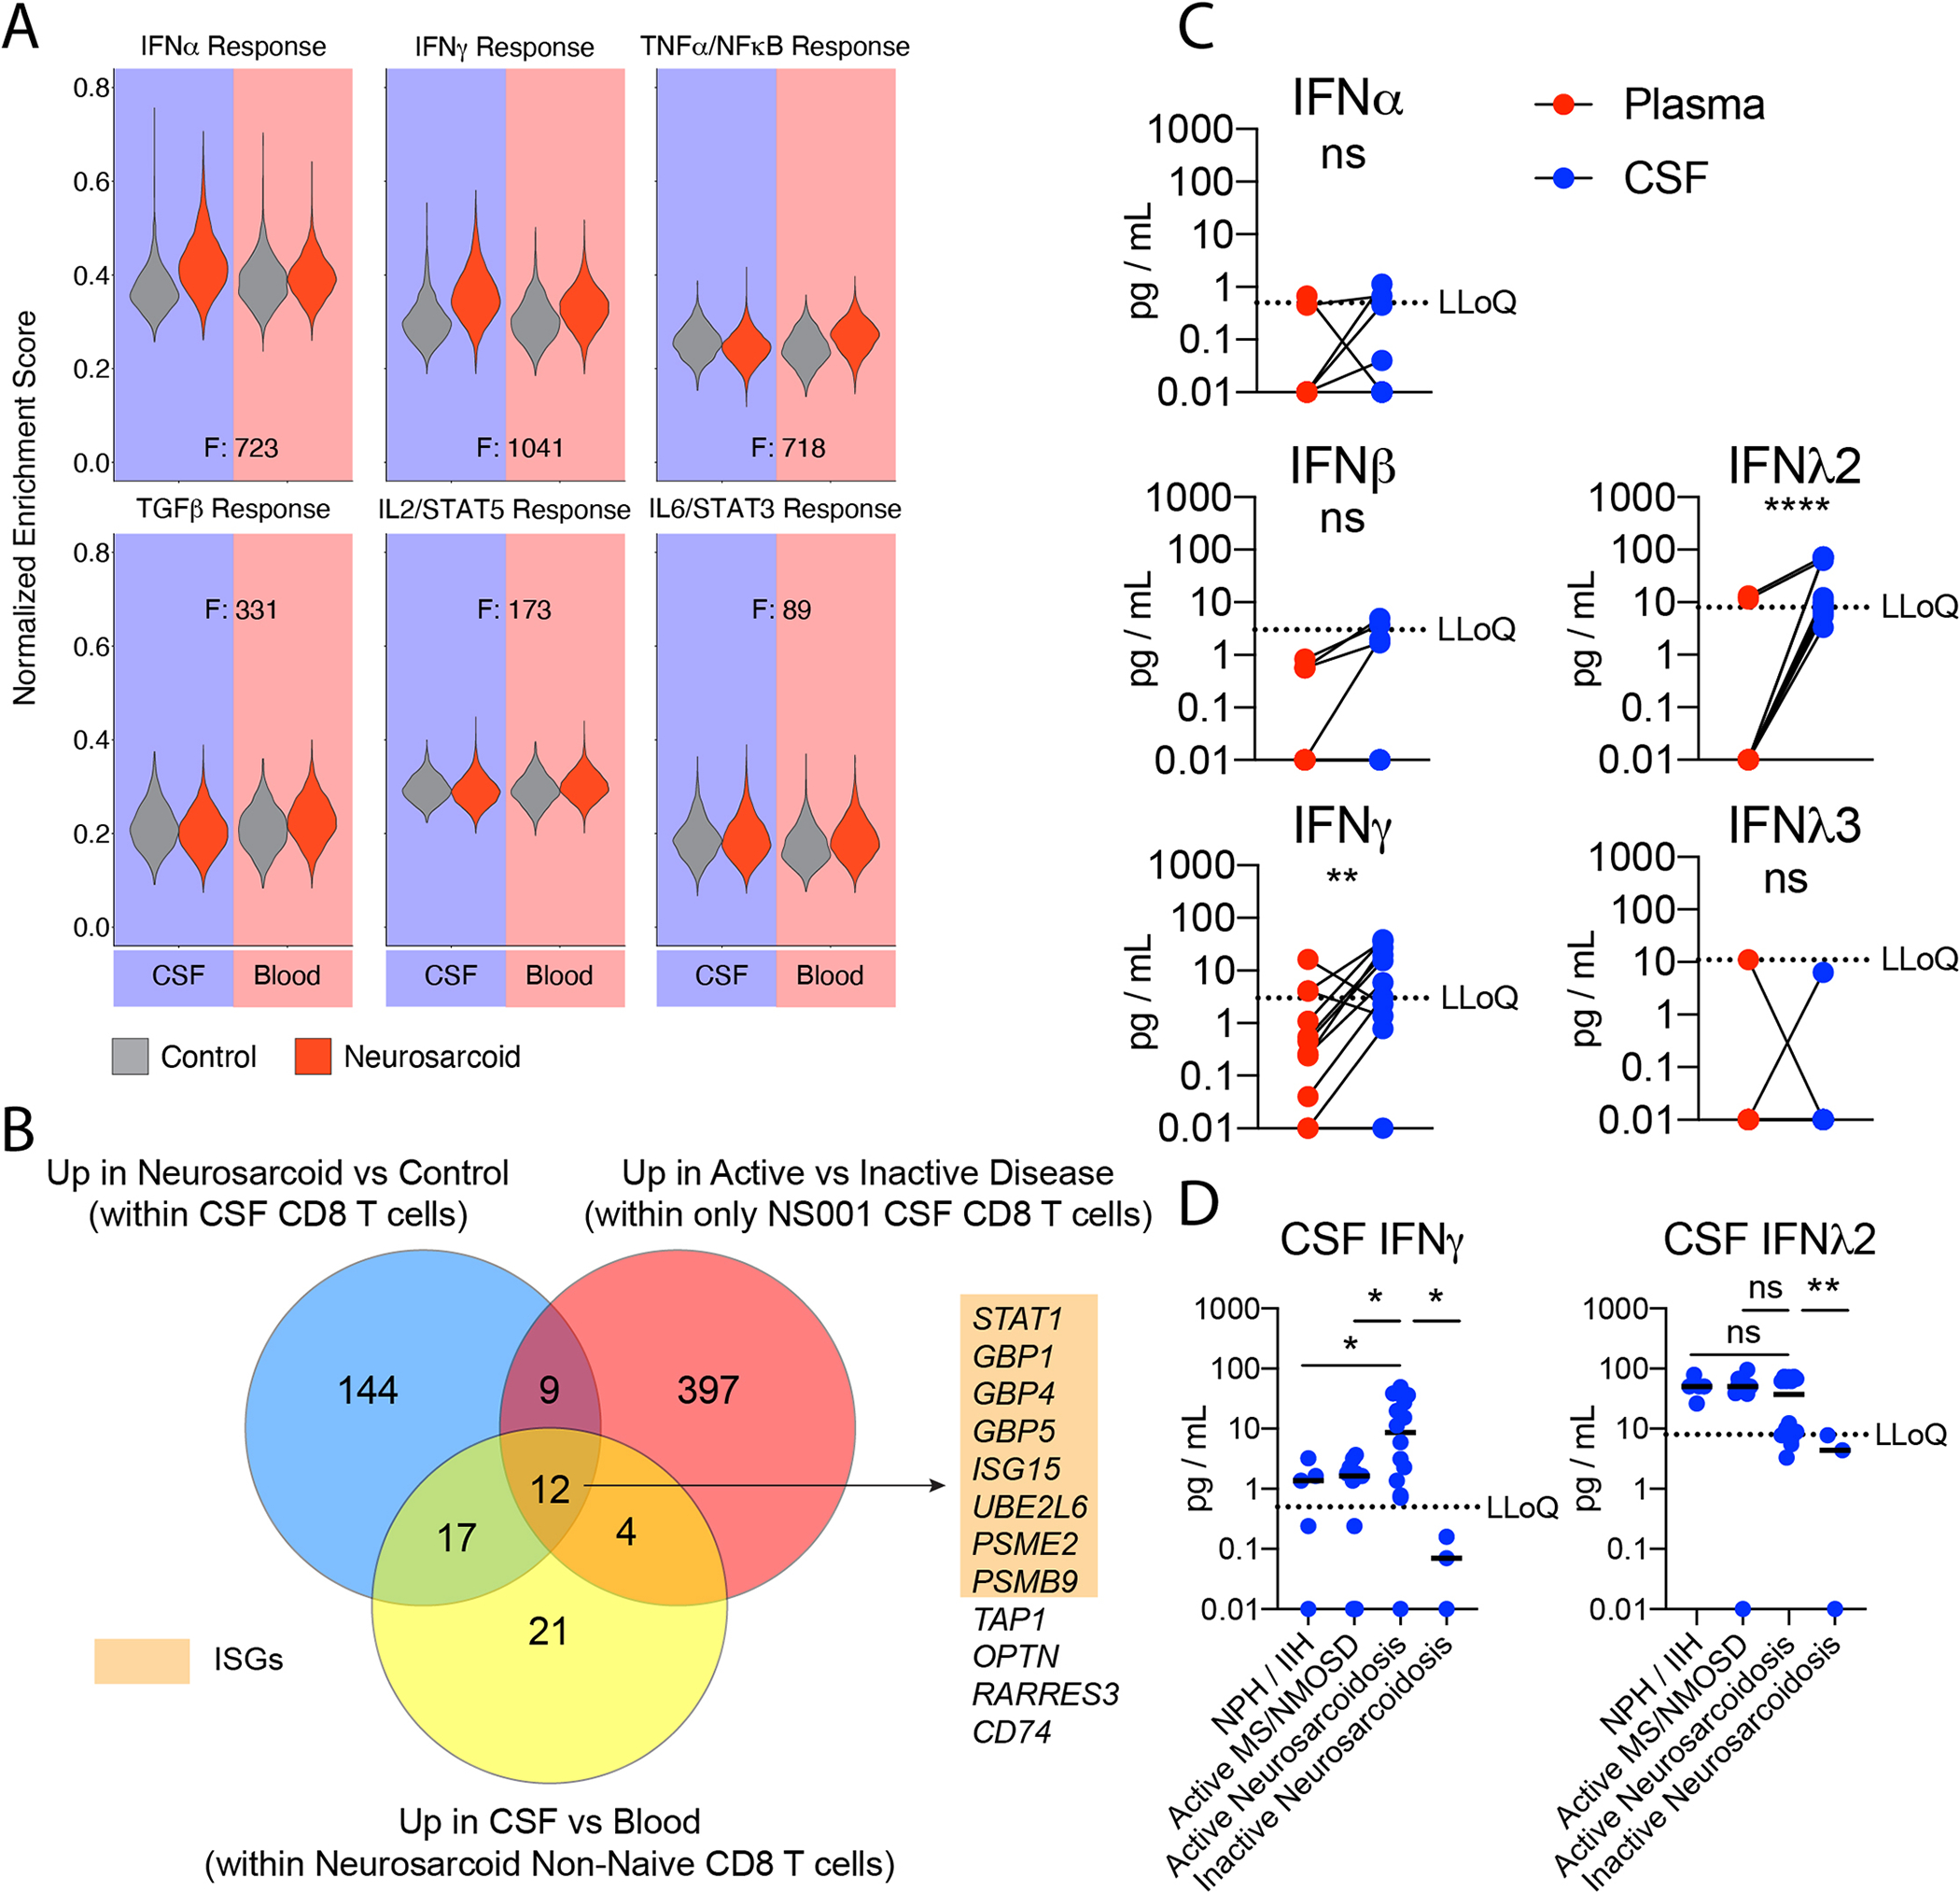
Figure 5. Interferon stimulated genes are a core signature in CSF CD8 T cells during active neurosarcoid.

(A) Violin plots of Normalized Enrichment Scores in CD8 T cells for indicated Hallmark gene sets from MSigDB. Each plot compares control (gray) and neurosarcoid (red) for CSF (left) and blood (right). F values as a measure of variance between tissue-groups is provided. (B) Venn diagram depicting the overlap of three sets of differentially expressed genes: (blue) upregulated genes within CSF CD8 T cells in neurosarcoid vs control participants, (yellow) upregulated genes within neurosarcoid non-naive CD8 T cells in CSF vs blood, and (red) upregulated genes within CSF CD8 T cells from a single participant (NS001) during active vs inactive disease. Numbers represent the quantity of genes within each region. Genes within the central overlapping region are listed. Interferon-stimulated genes (ISGs) are highlighted in orange. (C) Quantification of indicated interferons (IFN) in the Blood (red) and CSF (blue) of active Neurosarcoidosis (n=13). (Ratio paired t test). (D) Quantification of indicated IFN in the CSF of normal pressure hydrocephalus (NPH), idiopathic intracranial hypertension (IIH), active multiple sclerosis (MS) or neuromyelitis optica spectrum disorder (NMOSD), or active or inactive neurosarcoidosis. (Brown-Forsythe and Welch ANOVA followed by Dunnett’s T3 multiple comparisons test). LLoQ, lower limit of quantification. * p < 0.05; ** p < 0.01; **** p < 0.0001; ns p > 0.05
