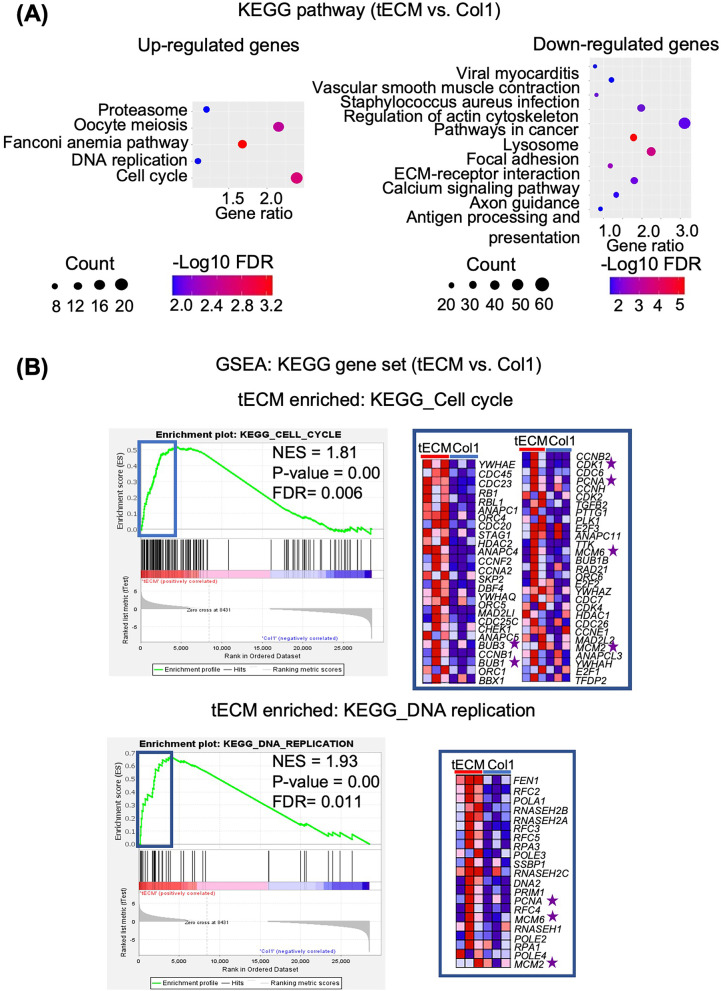
Fig. 7.
Pathway analysis of differential gene expression between tECM and Col1 treatment groups. A KEGG pathway analysis. Vertical—KEGG pathway, and horizontal—gene ratio, in the advanced bubble charts. The size and color of the bubbles represent the count and FDR value (log 10 transformed), respectively, of differential genes enriched in each pathway. B GSEA showing that the tECM group was significantly enriched in pathways associated with “cell cycle” (FDR = 0.006) and “DNA replication” (FDR = 0.011), as well as genes included for cell proliferation, such as PCNA and MCM. Relative levels of gene expression (red, high; blue, low) of the core enrichment genes are shown in the heat map

