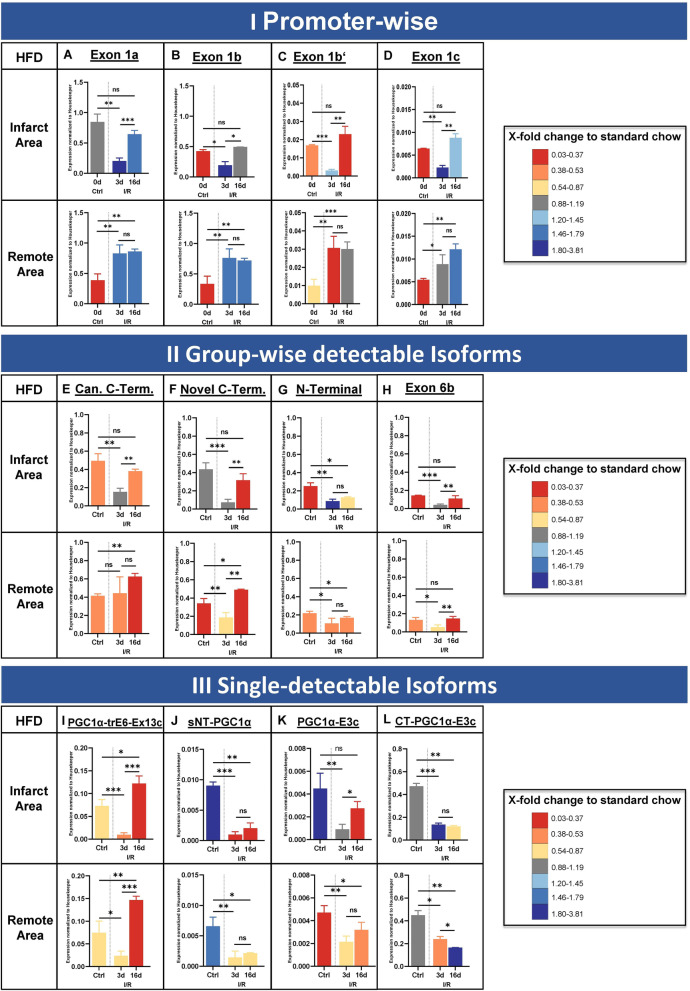
Fig. 7.
Impact of high-fat diet on promoter-specific expression. Expression levels for diet-induced obesity at baseline (Ctrl) and 3 or 16 days post ischemia / reperfusion injury (I/R) for different PGC-1α starting exons (A–D), for the four group-wise testable isoforms (E–H) and for the four single-detectable isoforms (I–L). Housekeeper-normalized expression values in area-at-risk (upper row) and remote area (bottom row). Colours of bars represent fold-change difference between high-fat (HFD) compared to standard chow (SD) diet, colour scheme likewise to heat map illustrations (i.e. dark green means higher, dark red means lesser expression in HFD compared to SD). A Exon 1a, originating from the canonical promoter. B, C Exons 1b and 1b’, under control by the alternative (known) promoter. D Novel exon 1c, originating from a new promoter site. E Isoforms with canonical C-terminal ending. F Isoforms with novel C-terminal ending. G Isoforms with N-terminal isoforms. H Isoforms with the novel exon 6b. I PGC-1α-trE6-Ex13c. J sNT-PGC-1α. K PGC-1α-E3c. L CT-PGC-1α-E3c. The recovery of expression in the infarct zone after 16 days (ratio between 3 and 16 days) under high-fat diet is impaired, leading to a continuing downregulation of exon 1a and b. For the group-wise detectable isoforms, the downregulation is dominant in the infarct zone and less in the remote area in direct comparison of expression values. Most of the isoforms recover expression values compared over time with exception of the N-terminal isoforms in infarct area. Data acquired by qPCR using primers covering specific exon-exon junctions. Expression values are normalized to housekeeper NUDC. n = 4 each, bars depict mean values, error bars represent SD. Significance calculated by unpaired Student’s t test (ns p ≤ 0.05, *p ≤ 0.05, **p ≤ 0.01, ***p ≤ 0.001)

