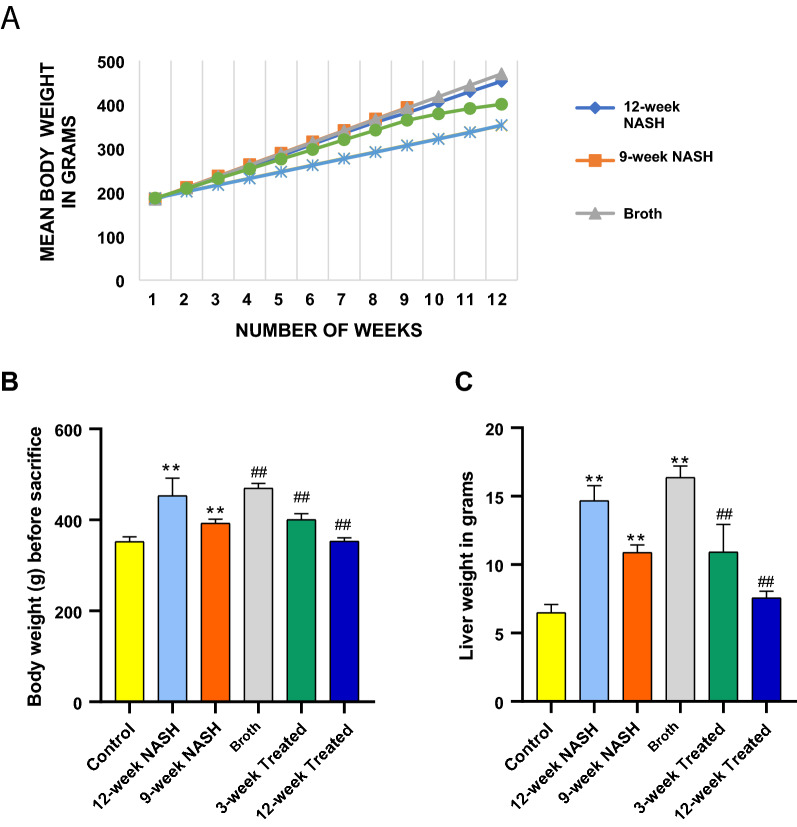
Fig. 4.
Effect of NASH induction and Probiotic administration on body weight and liver weight expressed in grams. A Mean body weight of each group for 12 weeks except 9-week NASH group. B Mean body weight of each groupat the end of the study, calculated in grams before sacrifaction at 12 weeks for all groups except for the 9-week NASH group, values are expressed as means ± SD. C Liver weight, values are expressed as means ± SD (n = 6). *p < 0.05 **p < 0.01 symbols are used when groups are compared with Control group while #p < 0.05 and ##p < 0.01 symbols are used when groups are compared to 12-week NASH group

