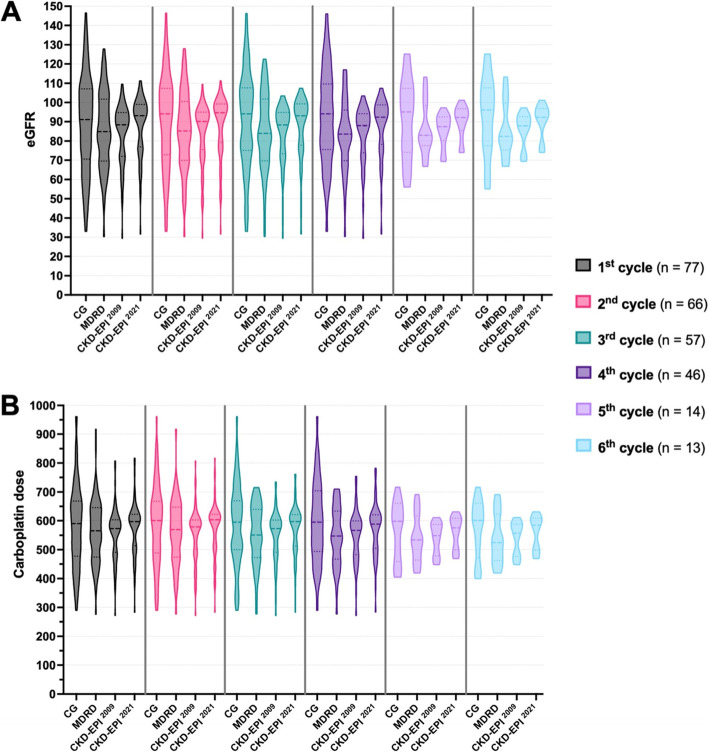
Fig. 3.
eGFR and carboplatin doses vary between different equations. A Violin graphs showing eGFR values in ml/min calculated by the CG, and ml/min/1.73 m2 calculated by the MDRD, CKD-EPI 2009, and CKD-EPI 2021. B Violin graphs showing carboplatin doses in mg for CG, and in mg/1.73 m2 for MDRD, CKD-EPI2009, and CKD-EPI2021 formulae. Values (eGFR or carboplatin dose) prior to each treatment cycle is indicated with a different colour. Median values are shown with dashed lines, and quartiles are shown with dotted lines. Only AUC-5/6 patients are included. See Supplementary Fig.1 for AUC-2 data

