Fig. 8.
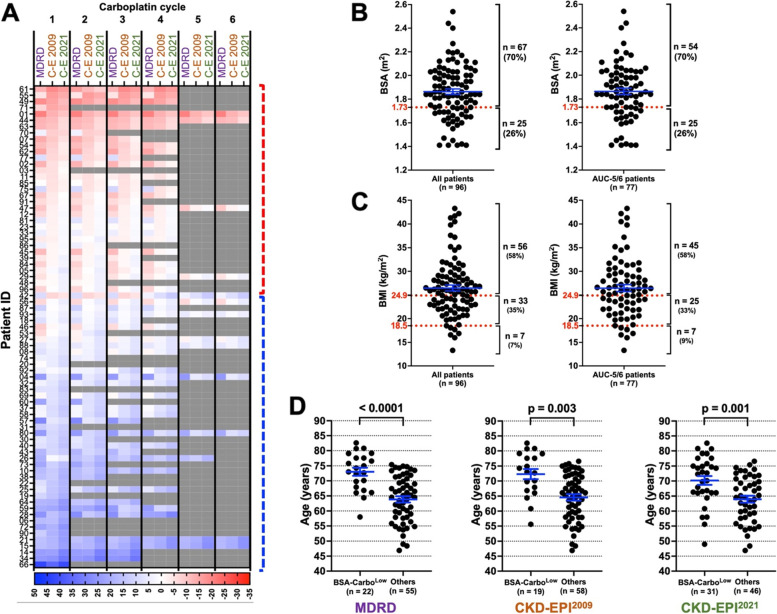
BSA adjustment reduces the differences between the CG and the MDRD-, CKD-EPI 2009-, or CKD-EPI 2021 equations. A BSA-adjusted MDRD-, CKD-EPI 2009-, and CKD-EPI 2021-based hypothetical carboplatin doses were compared to those that are based on the CG formula. Carboplatin percent changes are shown on heatmaps. Patients who would have received a lower dose based on MDRD, CKD-EPI 2009 and/or CKD-EPI 2021are shown with red boxes. Those who would have received a higher dose are shown with blue boxes. These two patient groups are indicated by vertical dashed or solid brackets. Grey boxes indicate a carboplatin cycle that was not administered. The intensity of the colours depicts the degree of change, and shown with a colour scale below the heatmaps. Carboplatin cycle numbers are displayed at the top of the heatmap. The name of each formula is indicated below the carboplatin cycle numbers. C-E 2009 and C-E 2021 stand for CKD-EPI 2009 and CKD-EPI 2021, respectively. B Scatter plots showing the BSA of all patients (left) and of AUC-5/6 patients only (right). C Scatter plots showing the BMI of all patients (left) and of AUC-5/6 patients only (right). D Age distribution of BSA-CarboLow patients and the rest of the cohort. Older age is a key determinant in BSA-adjusted carboplatin dosing. Mean and SEM is shown with blue lines in all graphs. 1.73 m2 BSA and healthy BMI (i.e., 18.5-24.9) are shown with dotted red lines

