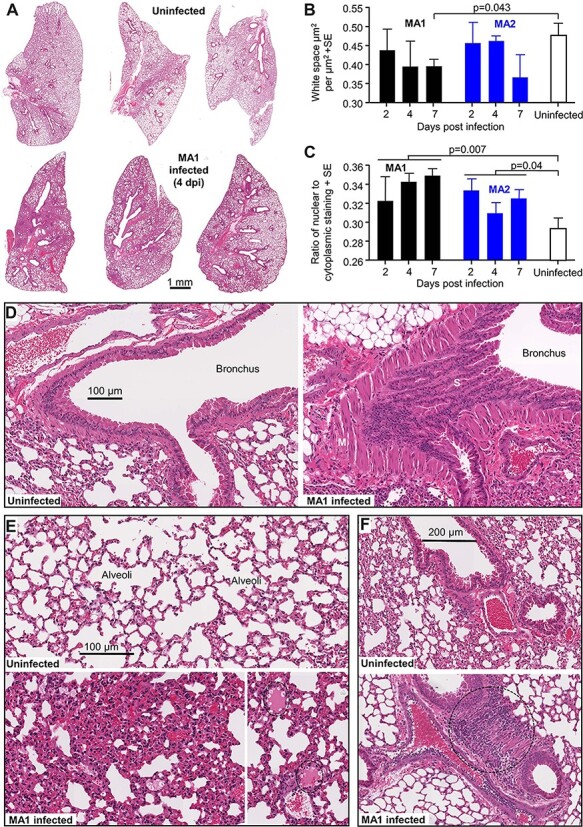
Figure 6.

H&E staining of lungs after infection of C57BL/6J mice with MA1 and MA2. (A) Representative low magnification images of H&E-stained lung sections for uninfected and MA1-infected C57BL/6J mice taken 4 days postinfection. (B) Image analysis to measure lung consolidation quantitated as an area of white space (unstained air spaces within the lung) per µm2 (n = 4 mice per group, with three sections scanned per lung and values averaged to produce one value for each lung). Statistics by t-test. (C) Image analysis to quantitate leukocyte infiltration. The ratios of nuclear (blue/dark purple) to cytoplasmic (red) staining of H&E-stained lung (n = 4 mice per group, with three sections scanned per lung and values averaged to produce one value for each lung). Statistics by t-tests, with data from the three time points for infected mice combined. (D) High magnification image showing bronchus from uninfected mice (left) and MA1-infected mice (right) on Day 4 postinfection. The latter shows sloughing of the bronchial epithelium (S) and smooth muscle hyperplasia (M). (E) High magnification image showing uninfected lungs (top) and MA1-infected lungs (4 dpi) (bottom). The latter shows lung consolidation and loss of alveolar air spaces, as well as pulmonary edema (dotted ovals, bottom right). (F) High magnification images of uninfected lungs (top) and in MA1-infected lungs on 4 dpi (bottom). The latter shows dense cellular infiltrate (dotted circle).
