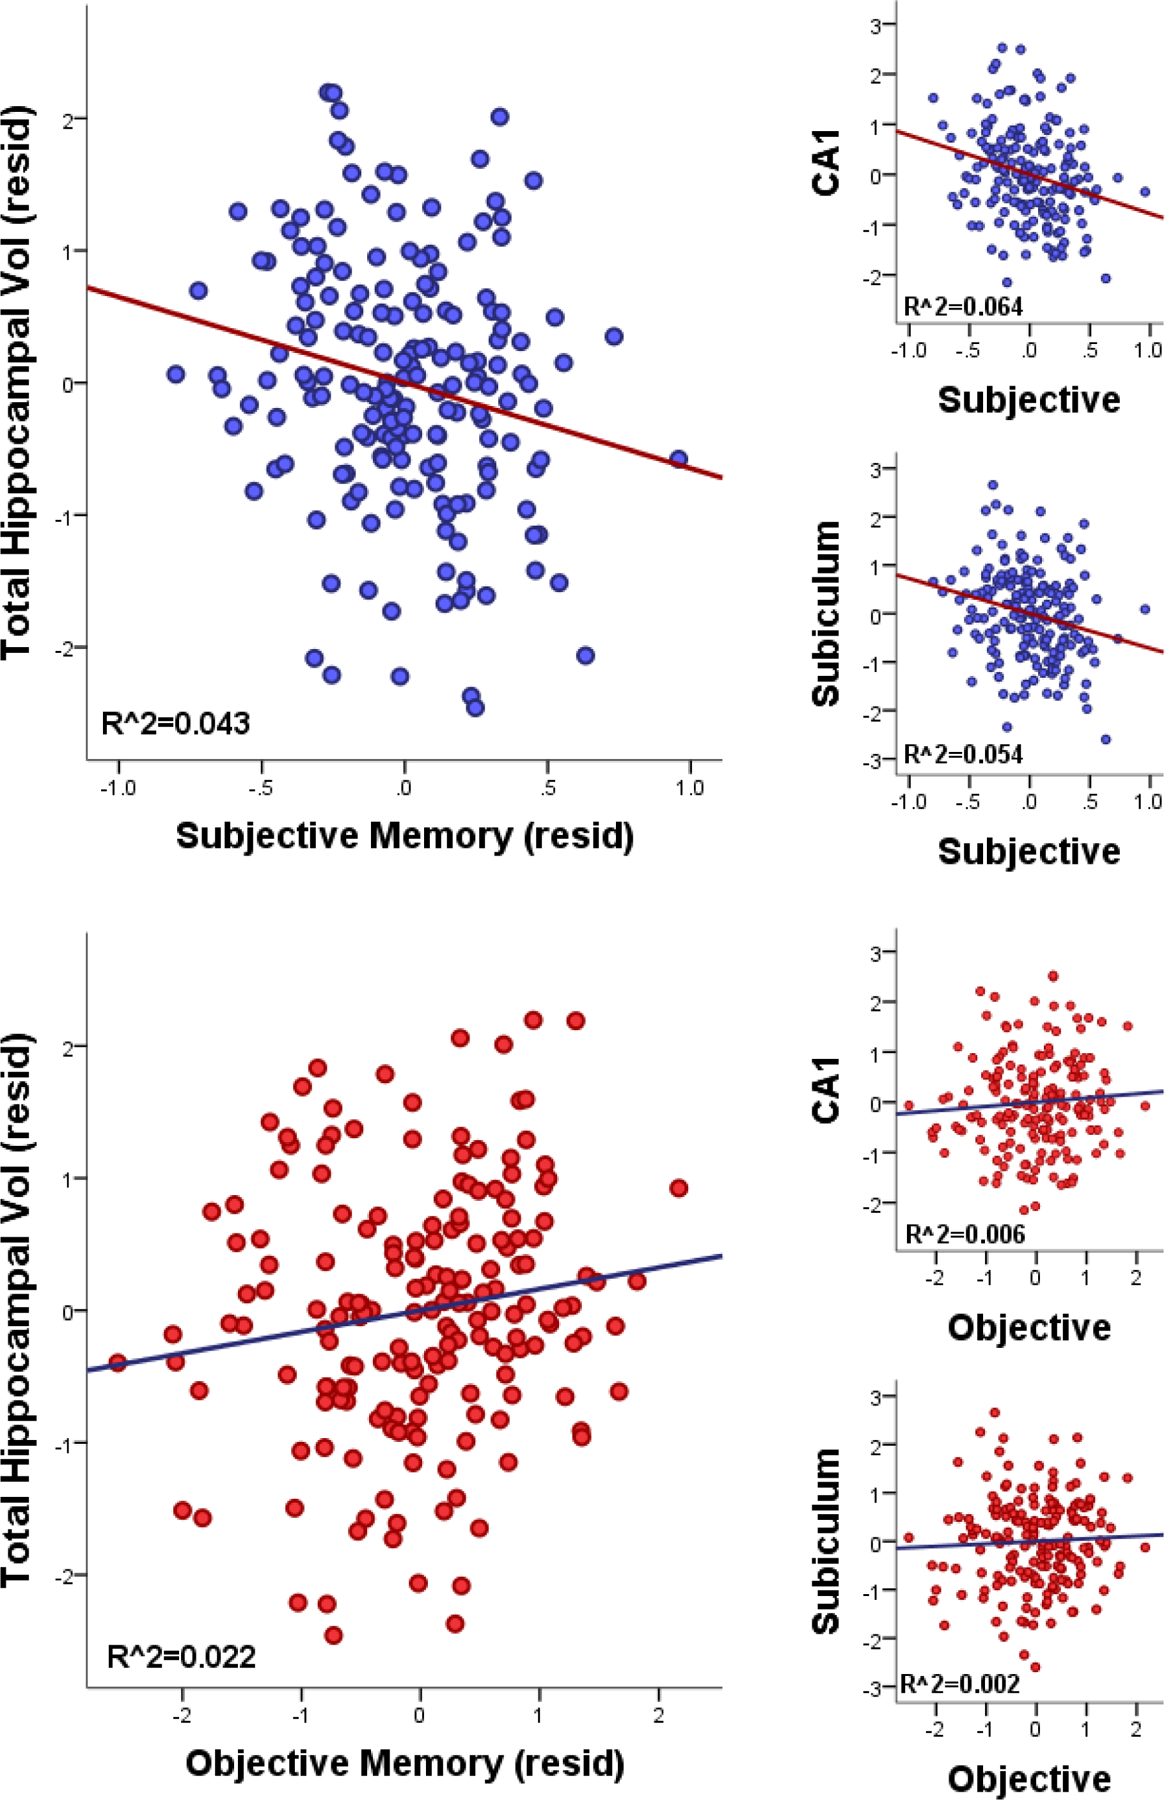
Figure 1. Scatterplots of Hippocampal Volumes and Subjective vs Objective Memory.

Scatterplots for fully-adjusted partial correlations (controlling for age, sex, mood, premorbid IQ) are shown between hippocampal volumes (total, CA1, subiculum) and subjective memory (top) and objective memory (bottom).
