. 2022 Apr 8;3(4):298–315. doi: 10.1158/2643-3230.BCD-21-0144

Figure 2.

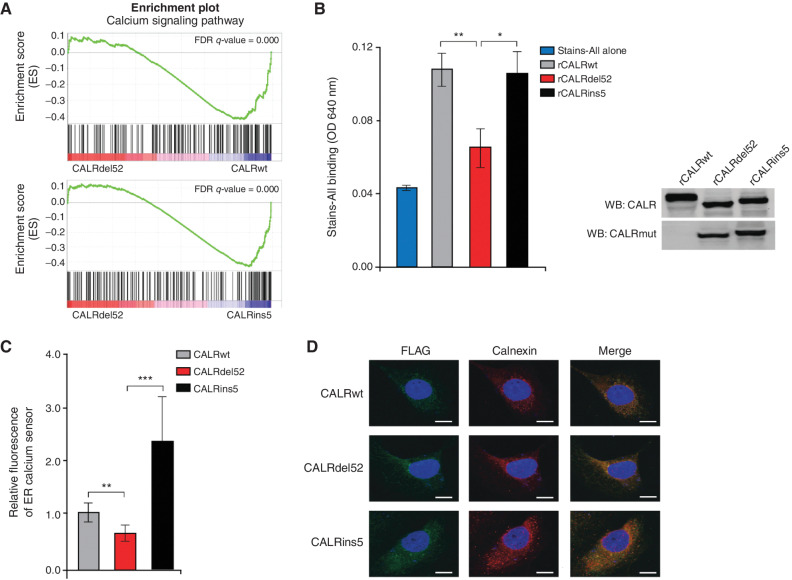
Figure 2. Type I CALRdel52 mutations lead to loss of Ca2+ binding function, resulting in ER Ca2+ depletion. A, GSEA plots for Ca2+ signaling pathway in Ba/F3-MPL-CALRdel52 cells versus Ba/F3-MPL-CALRwt cells (top) and Ba/F3-MPL-CALRins5 cells (bottom). B, Left, absorbance (640 nm) of 20 μg of recombinant CALRwt, CALRdel52, CALRins5 incubated with 0.025% stains-all solution to indirectly measure the Ca2+ binding ability of each rCALR protein. Each bar represents the average of three independent replicates. Error bars, SD. Significance was determined by two-tailed Student t test (*, P < 0.05; **, P < 0.01). Right, Western blot analysis for calreticulin (CALR; which detects both wild-type and mutant CALR) and mutant CALR (which only detects the mutant C-terminus) for rCALR proteins used in Stains-all assay. C, Quantification of relative fluorescence of Ca2+ sensor in U2OS cells expressing iV2-CALRwt, CALRdel52, and CALRins5. Each bar represents the average of five individual cells. Error bars, SD. Significance was determined by two-tailed Student t test (*, P < 0.05; **, P < 0.01). D, Immunofluorescence of Flag-tagged CALR variants (green) and ER marker calnexin (red) in U2OS cells. Nuclear staining with DAPI is shown in blue. Merge column depicts the overlay of Flag-CALR in green with the ER in red to demonstrate colocalization (yellow). Scale bar, 10 μm.

Type I CALRdel52 mutations lead to loss of Ca2+ binding function, resulting in ER Ca2+ depletion. A, GSEA plots for Ca2+ signaling pathway in Ba/F3-MPL-CALRdel52 cells versus Ba/F3-MPL-CALRwt cells (top) and Ba/F3-MPL-CALRins5 cells (bottom). B, Left, absorbance (640 nm) of 20 μg of recombinant CALRwt, CALRdel52, CALRins5 incubated with 0.025% Stains-All solution to indirectly measure the Ca2+ binding ability of each rCALR protein. Each bar represents the average of three independent replicates. Error bars, SD. Significance was determined by two-tailed Student t test (*, P < 0.05; **, P < 0.01). Right, Western blot analysis for calreticulin (CALR; which detects both wild-type and mutant CALR) and mutant CALR (which only detects the mutant C-terminus) for rCALR proteins used in Stains-All assay. C, Quantification of relative fluorescence of Ca2+ sensor in U2OS cells expressing iV2-CALRwt, CALRdel52, and CALRins5. Each bar represents the average of five individual cells. Error bars, SD. Significance was determined by two-tailed Student t test (*, P < 0.05; **, P < 0.01). D, Immunofluorescence of FLAG-tagged CALR variants (green) and ER marker calnexin (red) in U2OS cells. Nuclear staining with DAPI is shown in blue. Merge column depicts the overlay of FLAG-CALR in green with the ER in red to demonstrate colocalization (yellow). Scale bar, 10 μm.