. 2022 Apr 8;3(4):298–315. doi: 10.1158/2643-3230.BCD-21-0144

Figure 3.

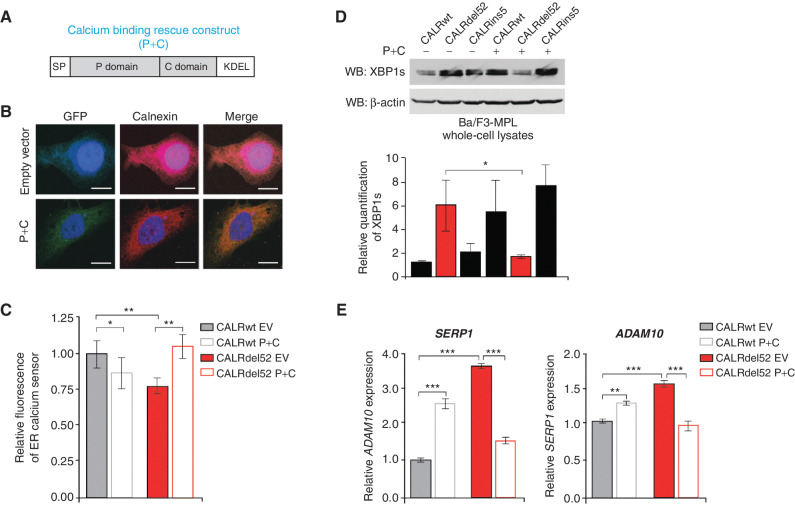
Figure 3. Type I mutant CALRdel52-driven ER Ca2+ depletion activates the IRE1α/XBP1 pathway. A, Schematic of the P+C rescue construct. The ER signal peptide was cloned just prior to the P domain to ensure proper localization of the protein. B, Immunofluorescence of empty GFP-expressing vector or P+C rescue construct in GFP-expressing backbone (green) and ER marker calnexin (red) in U2OS cells. Nuclear staining with DAPI is shown in blue. Merge column depicts the overlay of P+C in green with the ER in red to demonstrate colocalization (yellow). Scale bar, 10 μm. C, Quantification of relative fluorescence of Ca2+ sensor in U2OS cells expressing CALRwt + empty vector (control), CALRwt + P+C, CALRdel52 + empty vector, or CALRdel52 + P+C. Each bar represents the average of five independent replicates. Error bars, SD. Significance was determined by two-tailed Student t test (*, P < 0.05; **, P < 0.01). D, Top, Western blot analysis for spliced XBP1 (XBP1s) in Ba/F3-MPL cells expressing calreticulin (CALR) variants and either empty vector (−) or P+C (+) rescue construct. β-Actin was used as a loading control. Bottom, quantification of XBP1s band relative to β-actin control from two independent Western blots (shown above and in Supplementary Fig. S3B). Analysis was performed using Thermo Fisher Scientific iBright Analysis Software. Each bar represents the average of two independent replicates. Error bars, SD. Significance was determined by two-tailed Student t test (*, P < 0.05). E, qPCR for XBP1 targets ADAM10, and SERP1 in Ba/F3-MPL cells expressing CALRwt and CALRdel52 with or without the P+C rescue construct. Each bar represents the average of three independent replicates. Error bars, SD. Significance was determined by two-tailed Student t test (**, P < 0.01; ***, P < 0.001).

Type I mutant CALRdel52-driven ER Ca2+ depletion activates the IRE1α/XBP1 pathway. A, Schematic of the P+C rescue construct. The ER signal peptide was cloned just prior to the P domain to ensure proper localization of the protein. B, Immunofluorescence of empty GFP-expressing vector or P+C rescue construct in GFP-expressing backbone (green) and ER marker calnexin (red) in U2OS cells. Nuclear staining with DAPI is shown in blue. Merge column depicts the overlay of P+C in green with the ER in red to demonstrate colocalization (yellow). Scale bar, 10 μm. C, Quantification of relative fluorescence of Ca2+ sensor in U2OS cells expressing CALRwt + empty vector (control), CALRwt + P+C, CALRdel52 + empty vector, or CALRdel52 + P+C. Each bar represents the average of five independent replicates. Error bars, SD. Significance was determined by two-tailed Student t test (*, P < 0.05; **, P < 0.01). D, Top, Western blot analysis for spliced XBP1 (XBP1s) in Ba/F3-MPL cells expressing calreticulin (CALR) variants and either empty vector (−) or P+C (+) rescue construct. β-Actin was used as a loading control. Bottom, quantification of XBP1s band relative to β-actin control from two independent Western blots (shown above and in Supplementary Fig. S3B). Analysis was performed using Thermo Fisher Scientific iBright Analysis Software. Each bar represents the average of two independent replicates. Error bars, SD. Significance was determined by two-tailed Student t test (*, P < 0.05). E, qPCR for XBP1 targets ADAM10, and SERP1 in Ba/F3-MPL cells expressing CALRwt and CALRdel52 with or without the P+C rescue construct. Each bar represents the average of three independent replicates. Error bars, SD. Significance was determined by two-tailed Student t test (**, P < 0.01; ***, P < 0.001).