. 2022 Apr 8;3(4):298–315. doi: 10.1158/2643-3230.BCD-21-0144

Figure 5.

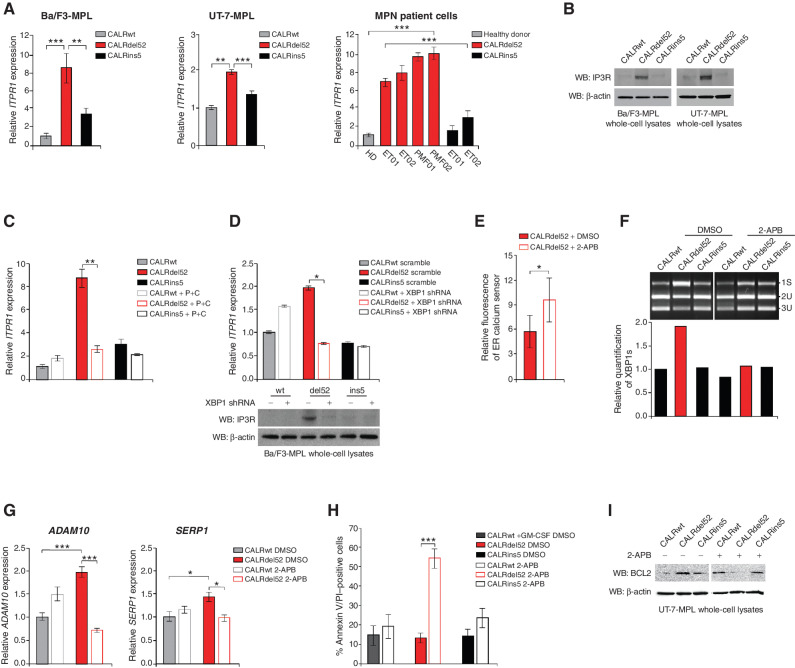
Figure 5. XBP1 upregulates the IP3 receptor to induce a positive feedback loop of sustained depleted ER Ca2+ and IRE1α/XBP1 pathway activation in type I CALRdel52-expressing cells. A, qPCR for ITPR1 in Ba/F3-MPL cells (left) and UT-7-MPL cells (middle) expressing CALRwt, CALRdel52, and CALRins5, and in peripheral blood mononuclear cells (PBMC) from a healthy donor (HD) or patients with myeloproliferative neoplasms (MPN; patient number depicted below each bar) with CALRdel52 or CALRins5 mutations (right). Each bar represents the average of three independent replicates. Error bars, SD. Significance was determined by two-tailed Student t test (**, P < 0.01; ***, P < 0.001). B, Western blot analysis for IP3R in Ba/F3-MPL and UT-7-MPL cells expressing calreticulin (CALR) variants. β-Actin was used as a loading control. C, qPCR for ITPR1 expression in Ba/F3-MPL cells expressing CALR variants and either empty vector or P+C rescue construct. Each bar represents the average of three independent replicates. Error bars, SD. Significance was determined by two-tailed Student t test (**, P < 0.01). D, Top, qPCR for ITPR1 expression in Ba/F3-MPL cells expressing CALR variants and a scramble shRNA or shRNA against XBP1. Each bar represents the average of three independent replicates. Error bars, SD. Significance was determined by two-tailed Student t test (*, P < 0.05). Bottom, Western blot analysis for IP3R in Ba/F3-MPL cells expressing CALR variants and a scramble shRNA (−) or shRNA against XBP1 (+). E, Quantification of relative fluorescence of Ca2+ sensor in U2OS cells expressing iV2-CALRdel52 treated with or without 2-APB (100 μmol/L for 1.5 minutes). Each bar represents the average of three independent replicates. Error bars, SD. Significance was determined by two-tailed Student t test (*, P < 0.05). F, Top, XBP1 splicing assay performed in Ba/F3-MPL cells expressing CALR variants treated with or without 2-APB (100 μmol/L for 24 hours). Top band shows the spliced form of XBP1 (s), bottom bands show the Pst1-digested unspliced form of XBP1 (us). Bottom, quantification of spliced XBP1 band. Analysis was performed using Thermo Fisher Scientific iBright Analysis Software. G, qPCR for ADAM10 and SERP1 expression in UT-7-MPL cells expressing CALR variants treated with or without 2-APB (100 μmol/L for 24 hours). Each bar represents the average of three independent replicates. Error bars, SD. Significance was determined by two-tailed Student t test (**, P < 0.01). H, Quantification of flow cytometric analysis for Annexin V/PI double positivity in Ba/F3-MPL cells expressing CALR variants and treated with or without 2-ABP (100 μmol/L for 72 hours). Each bar represents the average of three independent replicates. Error bars, SD. Significance was determined by two-tailed Student t test (***, P < 0.01). I, Western blot analysis for BCL-2 in Ba/F3-MPL cells expressing CALR variants and treated with or without 2-ABP (100 μmol/L for 24 hours). β-Actin was used as a loading control.

XBP1 upregulates the IP3 receptor to induce a positive feedback loop of sustained depleted ER Ca2+ and IRE1α/XBP1 pathway activation in type I CALRdel52-expressing cells. A, qPCR for ITPR1 in Ba/F3-MPL cells (left) and UT-7-MPL cells (middle) expressing CALRwt, CALRdel52, and CALRins5, and in peripheral blood mononuclear cells (PBMC) from a healthy donor (HD) or patients with myeloproliferative neoplasms (MPN; patient number depicted below each bar) with CALRdel52 or CALRins5 mutations (right). Each bar represents the average of three independent replicates. Error bars, SD. Significance was determined by two-tailed Student t test (**, P < 0.01; ***, P < 0.001). B, Western blot analysis for IP3R in Ba/F3-MPL and UT-7-MPL cells expressing calreticulin (CALR) variants. β-Actin was used as a loading control. C, qPCR for ITPR1 expression in Ba/F3-MPL cells expressing CALR variants and either empty vector or P+C rescue construct. Each bar represents the average of three independent replicates. Error bars, SD. Significance was determined by two-tailed Student t test (**, P < 0.01). D, Top, qPCR for ITPR1 expression in Ba/F3-MPL cells expressing CALR variants and a scramble shRNA or shRNA against XBP1. Each bar represents the average of three independent replicates. Error bars, SD. Significance was determined by two-tailed Student t test (*, P < 0.05). Bottom, Western blot analysis for IP3R in Ba/F3-MPL cells expressing CALR variants and a scramble shRNA (−) or shRNA against XBP1 (+). E, Quantification of relative fluorescence of Ca2+ sensor in U2OS cells expressing iV2-CALRdel52 treated with or without 2-APB (100 μmol/L for 1.5 minutes). Each bar represents the average of three independent replicates. Error bars, SD. Significance was determined by two-tailed Student t test (*, P < 0.05). F, Top, XBP1 splicing assay performed in Ba/F3-MPL cells expressing CALR variants treated with or without 2-APB (100 μmol/L for 24 hours). Top band shows the spliced form of XBP1 (s), bottom bands show the Pst1-digested unspliced form of XBP1 (us). Bottom, quantification of spliced XBP1 band. Analysis was performed using Thermo Fisher Scientific iBright Analysis Software. G, qPCR for ADAM10 and SERP1 expression in UT-7-MPL cells expressing CALR variants treated with or without 2-APB (100 μmol/L for 24 hours). Each bar represents the average of three independent replicates. Error bars, SD. Significance was determined by two-tailed Student t test (**, P < 0.01). H, Quantification of flow cytometric analysis for Annexin V/PI double positivity in Ba/F3-MPL cells expressing CALR variants and treated with or without 2-ABP (100 μmol/L for 72 hours). Each bar represents the average of three independent replicates. Error bars, SD. Significance was determined by two-tailed Student t test (***, P < 0.01). I, Western blot analysis for BCL-2 in Ba/F3-MPL cells expressing CALR variants and treated with or without 2-ABP (100 μmol/L for 24 hours). β-Actin was used as a loading control.