
Fig. 7.
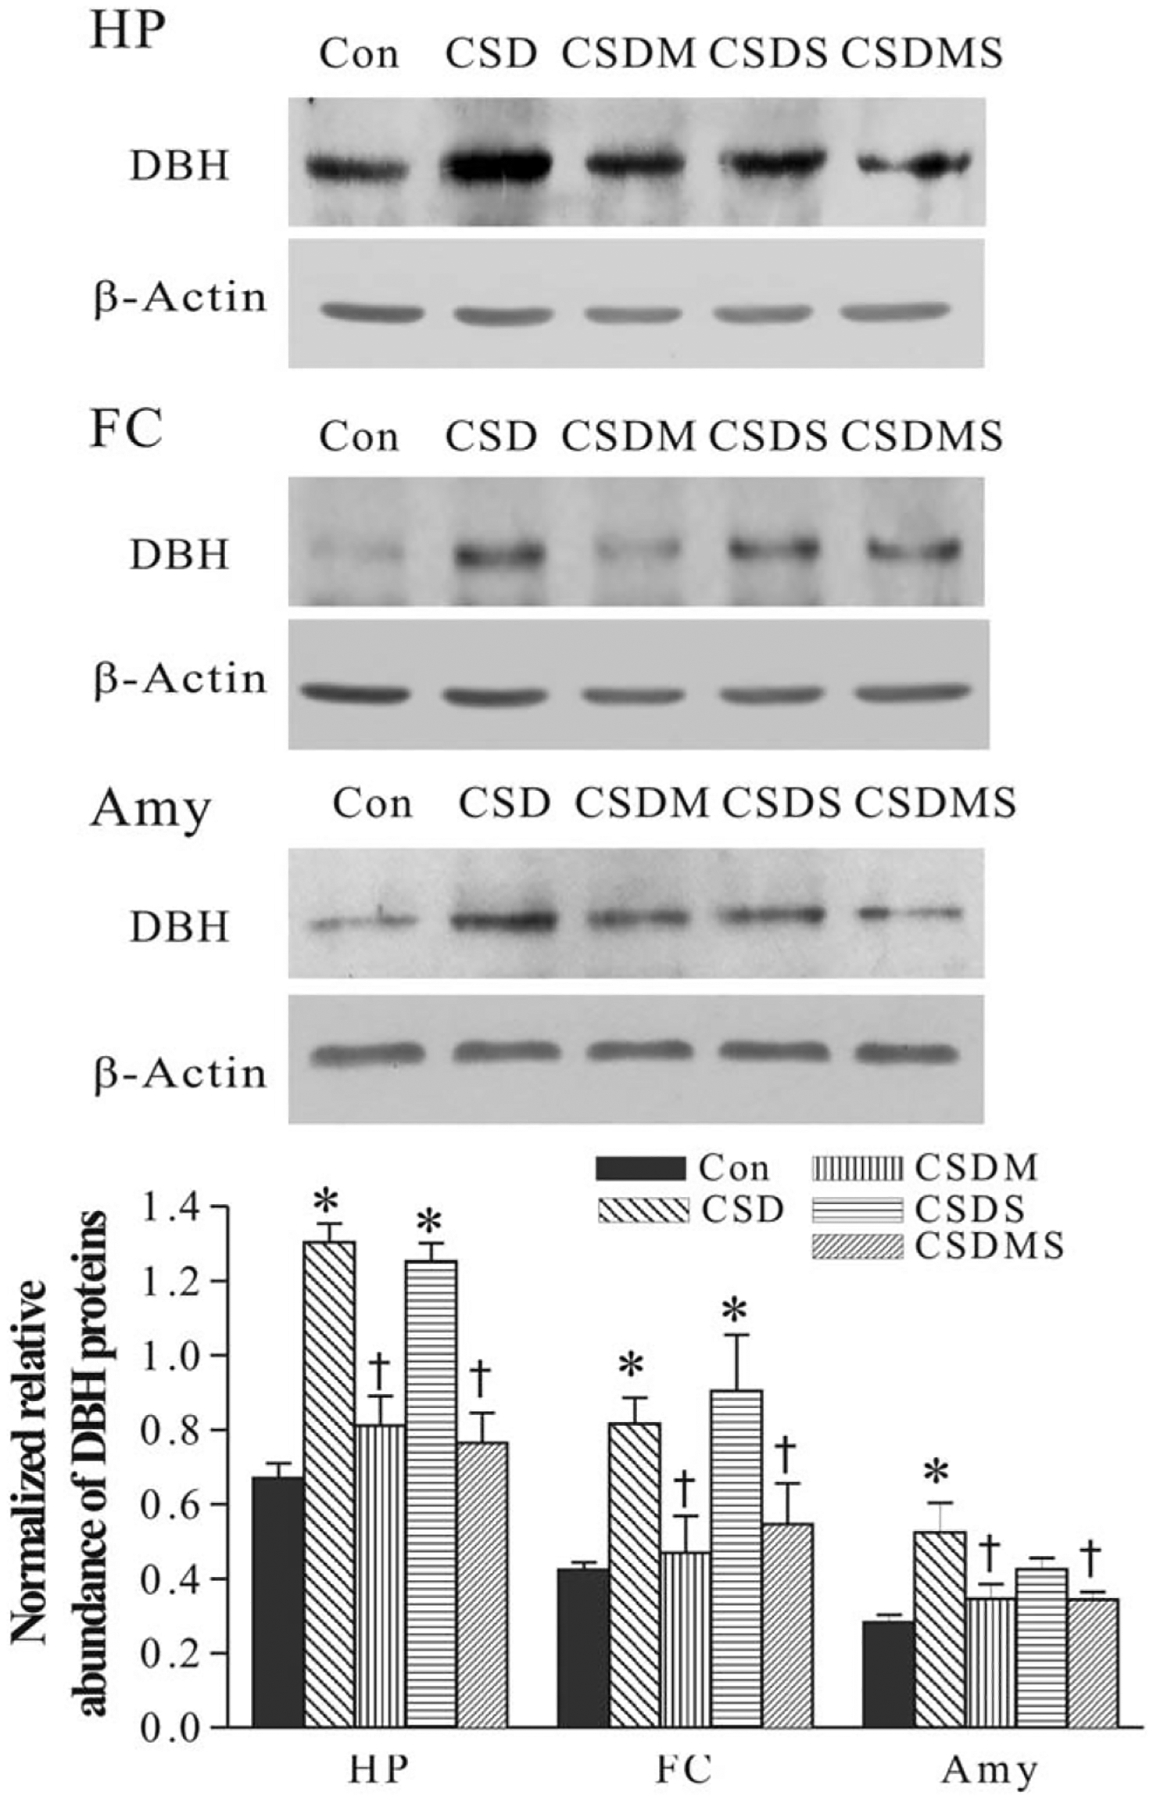
Effect of CSD and treatment with corticosteroid receptor antagonists on DBH protein levels the hippocampus (HP), frontal cortex (FC) and amygdala (Amy). The image figures show autoradiographs obtained by western blotting of DBH in different regions (n = 6–8/group). The lower graph shows quantitative analysis of band densities. Values of DBH bands were normalized to those of β-actin probed on the same blot. *P < 0.01, compared with the control group. †P < 0.01, compared with the CSD group. See Figure 2 for abbreviations.