. 2021 Jul 29;27(20):5536–5545. doi: 10.1158/1078-0432.CCR-21-0360

Figure 2.

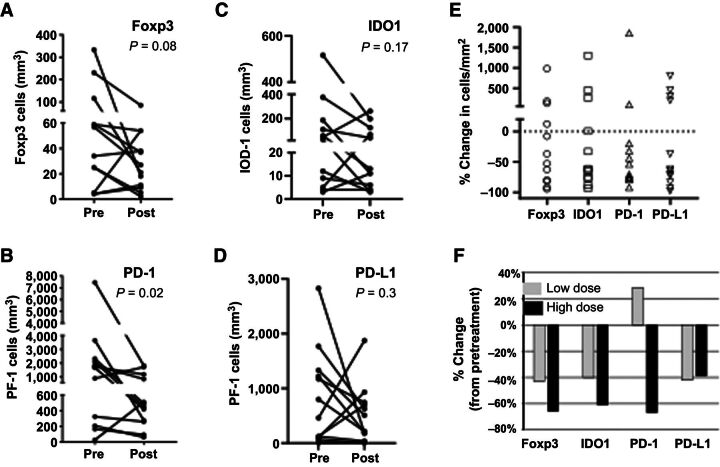
Figure 2. Changes in immunosuppressive markers in the tumor microenvironment following GEN-1 and NACT treatment. Changes in Foxp3 (A), PD-1 (B), IDO1 (C), and PD-L1 (D) immune cell markers before treatment (pre) and after treatment and at debulking surgery (post) for individual patients. E, Percent changes in each of the cell types. F, Percent changes between the low-dose group (36, 47 mg/m2; n = 4) and the high-dose group (61, 79 mg/m2; n = 8). The paired comparison of pre- and posttreatment values was done by using Wilcoxon matched pairs signed-rank test.

Changes in immunosuppressive markers in the tumor microenvironment following GEN-1 and NACT treatment. Changes in Foxp3 (A), PD-1 (B), IDO1 (C), and PD-L1 (D) immune cell markers before treatment (pre) and after treatment and at debulking surgery (post) for individual patients. E, Percent changes in each of the cell types. F, Percent changes between the low-dose group (36, 47 mg/m2; n = 4) and the high-dose group (61, 79 mg/m2; n = 8). The paired comparison of pre- and posttreatment values was done by using Wilcoxon matched pairs signed-rank test.