. 2021 Jul 29;27(20):5536–5545. doi: 10.1158/1078-0432.CCR-21-0360

Figure 4.

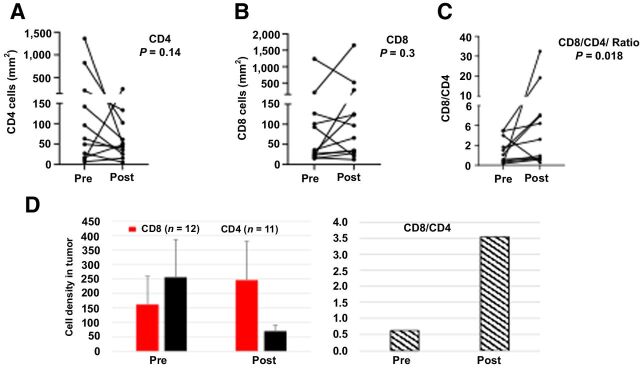
Figure 4. Changes in CD4 and CD8 cell density following GEN-1 and chemotherapy treatment. A and B, Changes in CD4 and CD8 cell density in individual patients before treatment (pre) and after treatment and at debulking surgery (post). C, CD8/CD4 cell ratio at pre- and post-treatment. D, Mean values. The paired comparison of pre- and posttreatment values was done by using Wilcoxon matched pairs signed-rank test.

Changes in CD4 and CD8 cell density following GEN-1 and chemotherapy treatment. A and B, Changes in CD4 and CD8 cell density in individual patients before treatment (pre) and after treatment and at debulking surgery (post). C, CD8/CD4 cell ratio at pre- and post-treatment. D, Mean values. The paired comparison of pre- and posttreatment values was done by using Wilcoxon matched pairs signed-rank test.