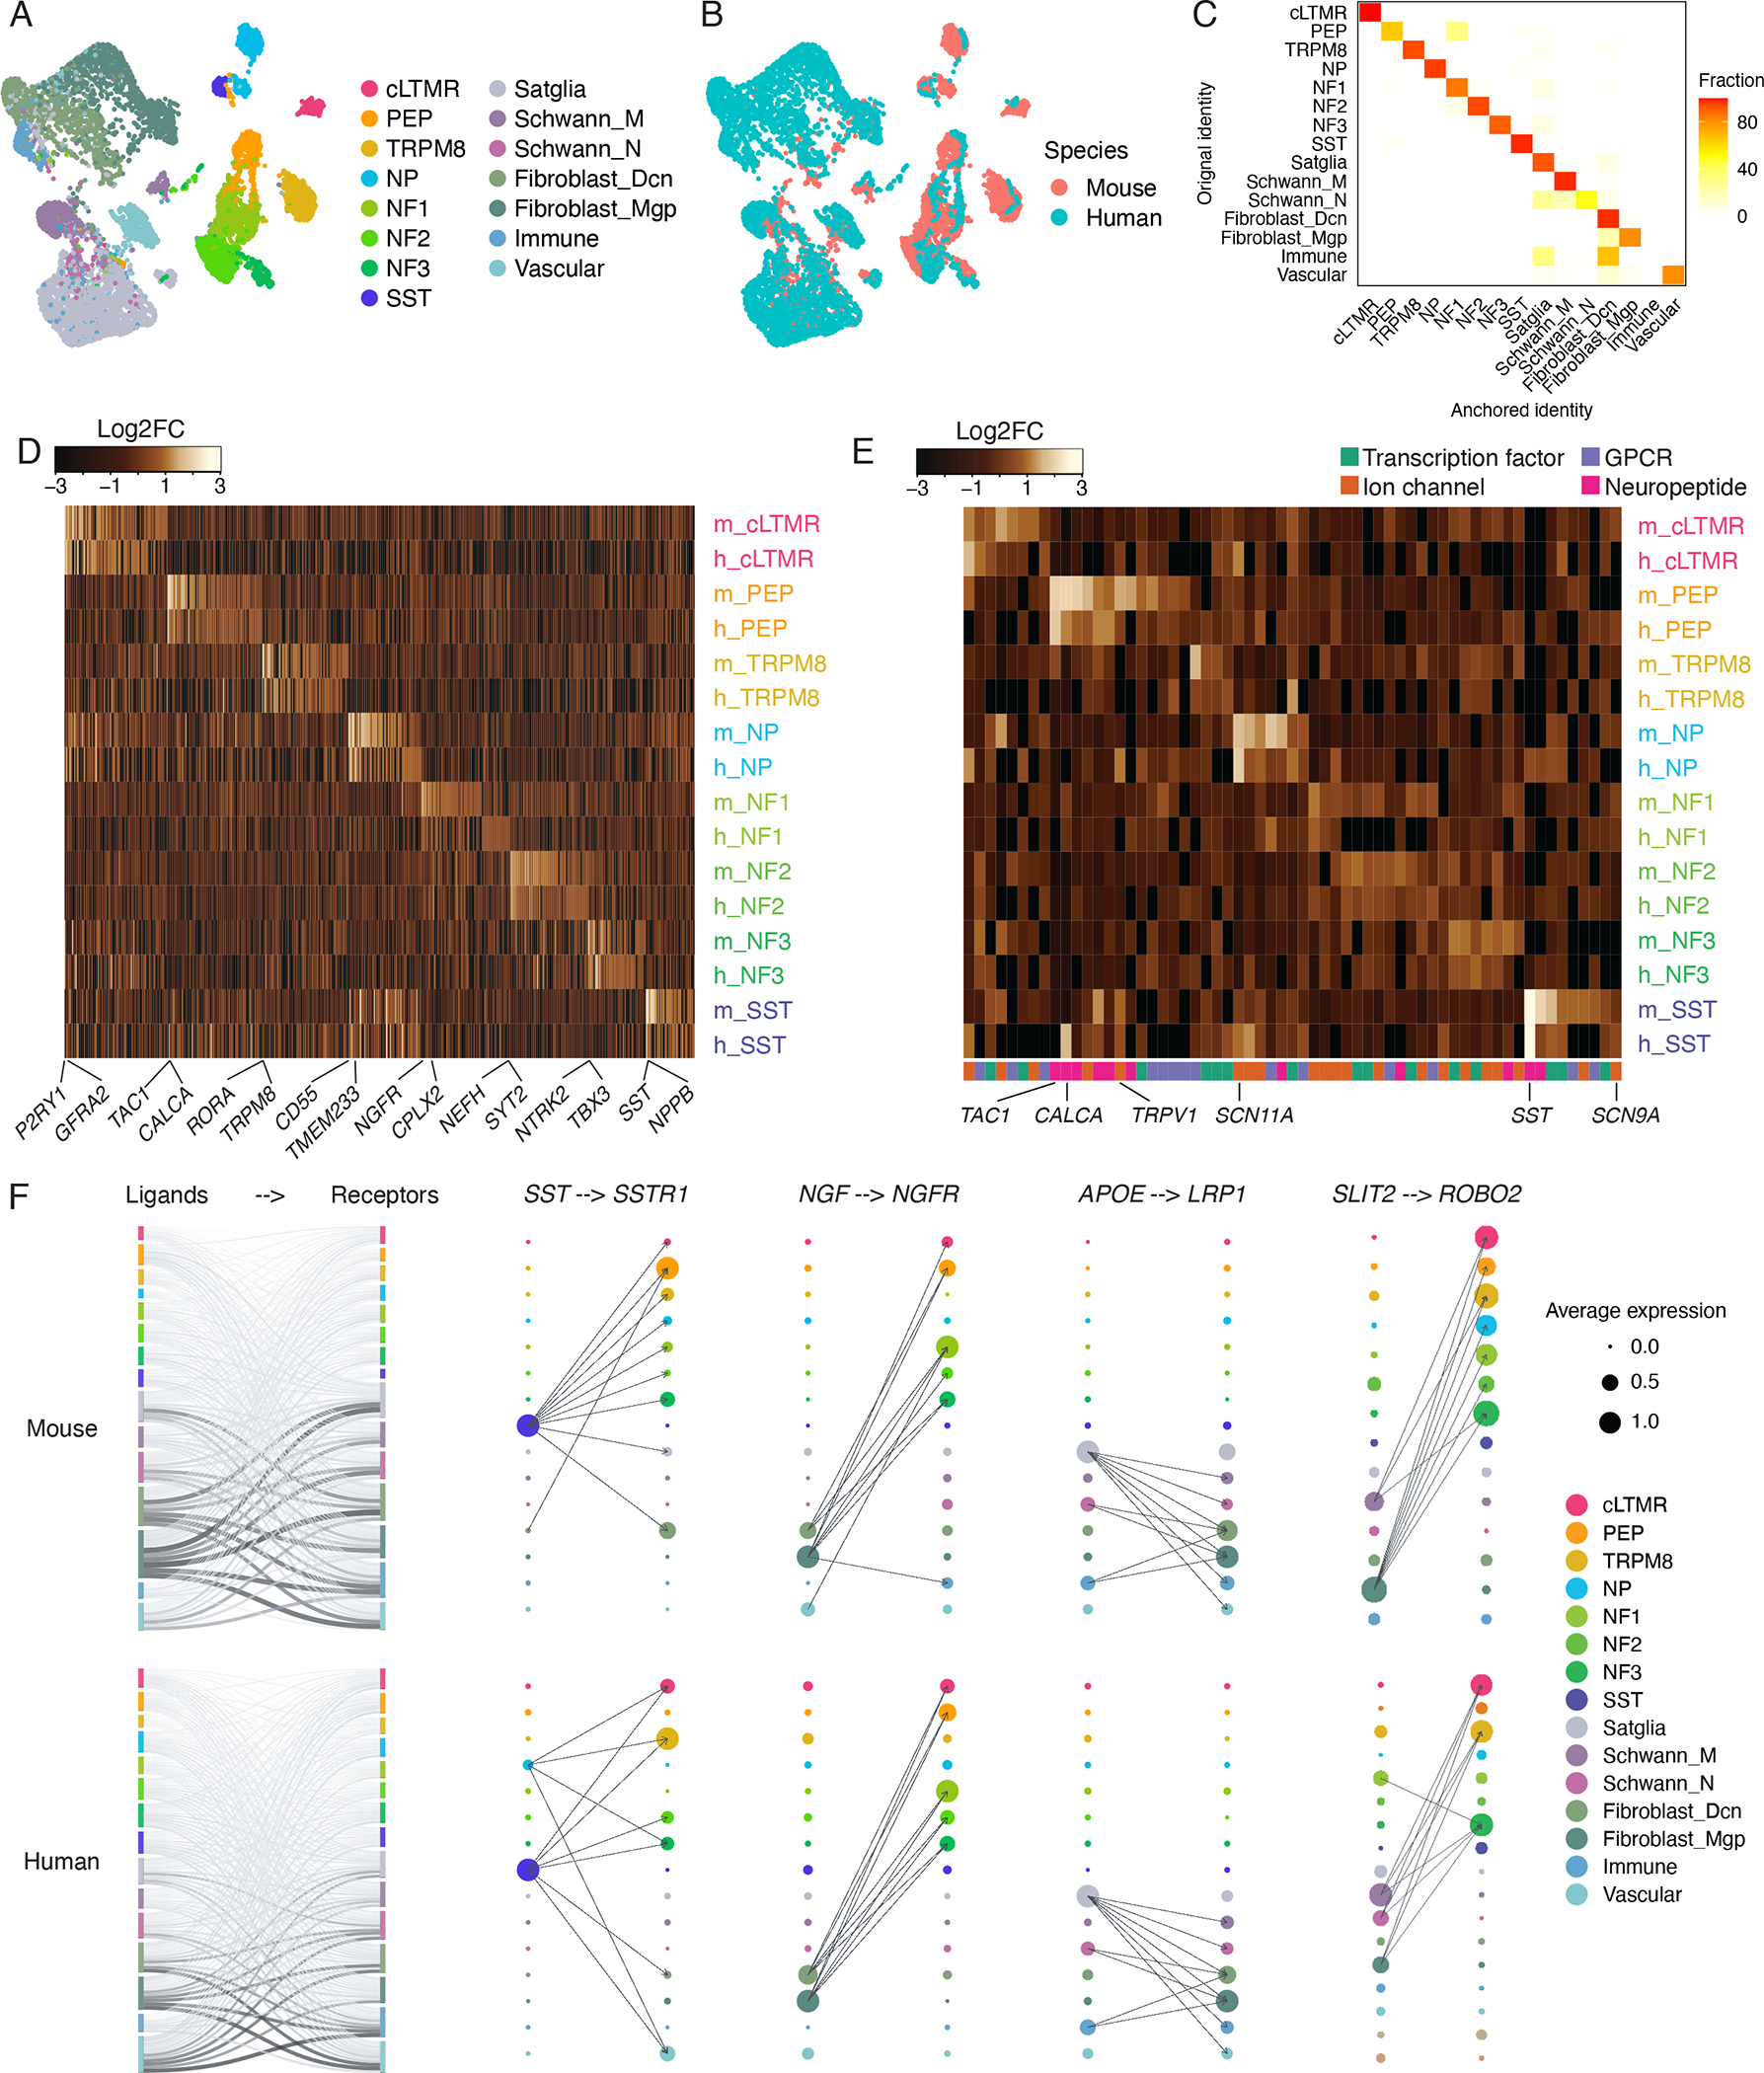
Figure 2. Evolutionary conservation of mouse and human TG cell types.

A-B. UMAP plots of human TG snRNA-seq data anchored to the mouse TG snRNA-seq data (see methods). Each species is downsampled to display 5,000 nuclei. (A) Colors represent cell type classifications determined from clustering each species separately prior to anchoring (as in Figures 1A–B). (B) Colors represent species.
C. Overlap of human TG cell types between the initial classifications (as in Figure 1B) and the classifications assigned by anchoring human TG to the male mouse TG reference (see methods). Plot displays fraction of nuclei within the initial cell type assignment that is assigned to each TG cell type after anchoring to the mouse TG reference.
D. Heatmap of evolutionarily conserved cell-type-specific gene expression (columns) in mouse and human TG cell types (rows, m = mouse, h = human). Cell-type-specific genes in each species are included in the heatmap if they are significantly enriched in a cell type compared to all other cell types (FDR < 0.01, top 50 genes by log2FC per cell type, Table S2).
E. Heatmap of select gene expression patterns (columns) in mouse and human TG cell types (rows, m = mouse, h = human). Genes are included in the heatmap if they are significantly enriched in a cell type compared to all other cell types (FDR < 0.05, log2FC > 0.5, Table S2).
F. Ligand-receptor interactions in mouse and human TG. Left) Putative interactions between ligands and receptors within mouse (top row) and human (bottom row) TG cell types. Vertical bars are colored by cell type and the height of bars depict the number of ligands (left column) and receptors (right column) in the given cell type. The thickness of connecting lines is proportional to the number of total ligand-receptor interactions between the two connecting cell types. Right) Dot size denotes relative expression of a gene in each cell type, and colors indicate cell type. Arrows between cell types denote the 10 highest ligand-receptor scores (The full set of ligand-receptor pairs can be found in Table S3).
