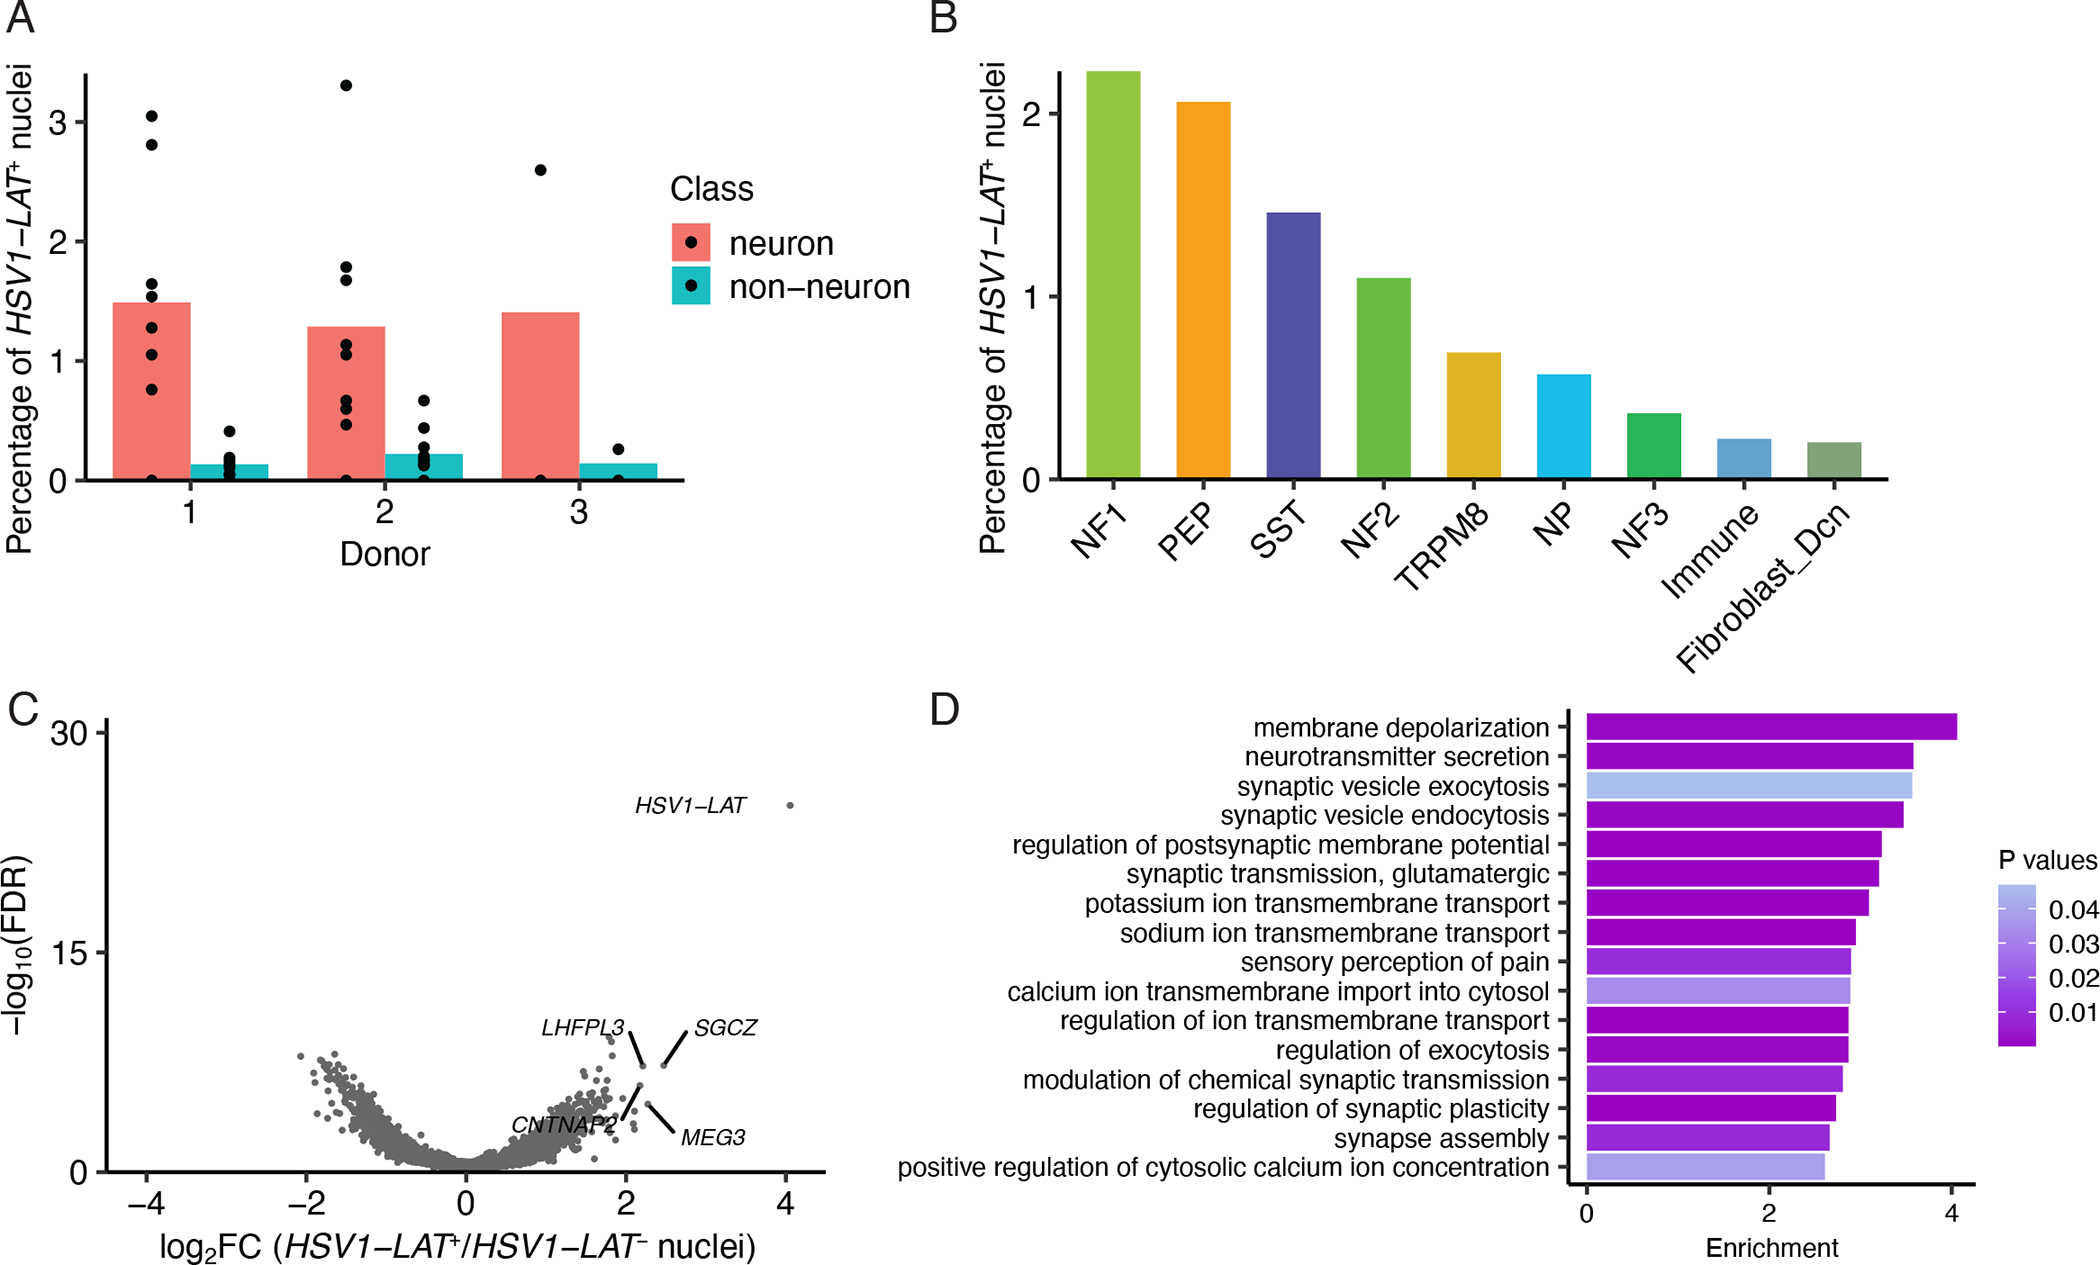
Figure 4. Latent alphaherpes virus expression in human TG neurons.

A. Percentage of HSV1_LAT+ neurons or non-neuronal cells in each donor. Dots show percentage of HSV1_LAT+ nuclei in each library and bars indicate the average across libraries.
B. Percentage of each neuronal subtype that are HSV1_LAT+ across all donors.
C. Volcano plot displaying differential gene expression between HSV1_LAT+ and HSV1_LAT- nuclei. HSV1-LAT (n = 115) and the same number of randomly selected cells of the same cell type distribution without detectable expression of HSV1_LAT. Significance is displayed on the Y-axis as -log10 False Discovery Rate (FDR); magnitude of differences is displayed on X-axis as log2 Fold Change (FC).
D. Gene ontology analysis of differentially expressed genes (Log2FC > 1, FDR < 0.05) between HSV1_LAT+ and HSV1_LAT- nuclei. Enrichment is the number of times an ontology term is observed in the differentially expressed gene set over a random gene set of expressed genes.
Bar shows enrichment and color shows P-value.
