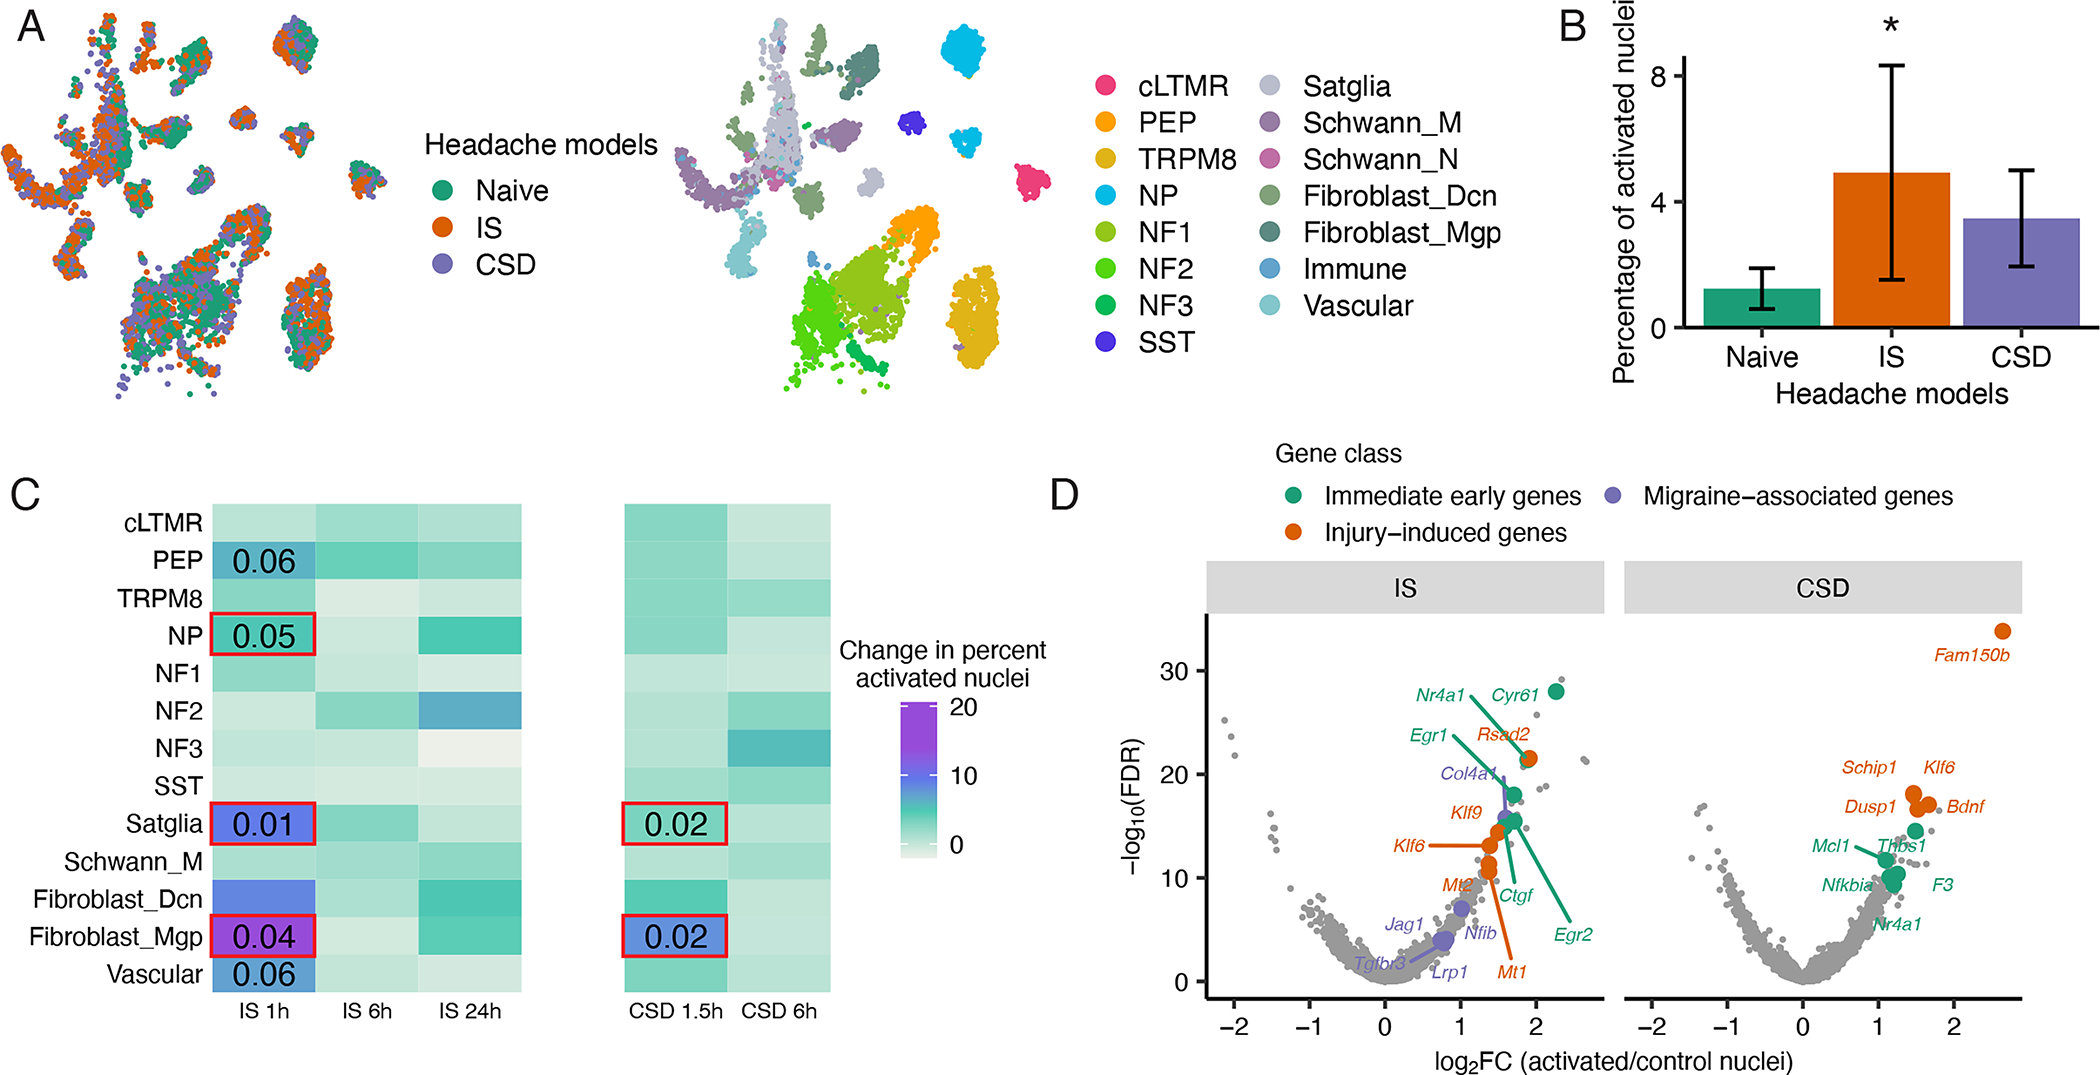
Figure 7. Activation of multiple TG cell types in mouse models of headache.

A. UMAP plots of snRNA-seq data from 96,933 mouse TG nuclei from both naive and headache models (downsampled to display 3,000 naive, 3,000 IS, and 3,000 CSD). Nuclei are colored by condition (left) or by cell type (right).
B. Fraction of nuclei in each headache model that display a transcriptionally activated state after IS or CSD as defined by the expression of a panel of immediate early genes (IEG) (see Act-seq methods). There are significantly more transcriptionally activated nuclei after IS than in naive (*P < 0.05, two-tailed Student’s t-test, error bars are SEM).
C. Heatmap showing change in percentage of transcriptionally activated nuclei in each TG cell type after IS or CSD compared naive. Significant effects of IS were observed in NP, satellite glia and fibroblasts (*P < 0.05 1-way ANOVA, see Figure S6C for ANOVA statistics); strong trends were observed in PEP and vascular cells. Significant effects of CSD were observed in satellite glia and fibroblasts (*P < 0.05, 1-way ANOVA, see Figure S6D for ANOVA statistics).
D. Volcano plot of differentially expressed genes between transcriptionally activated nuclei in Left) IS or Right) CSD and the same number of randomly selected control cells of the same cell type distribution. Significance is displayed on the Y-axis as -log10 False Discovery Rate (FDR); magnitude of gene expression differences is displayed on X-axis as log2 Fold Change (FC). Top five genes by log2FC in each gene class are labeled. Immediate early genes (IEGs) are orange, genes that are activated by axonal injury (see methods) are green, and migraine-associated genes are purple.
