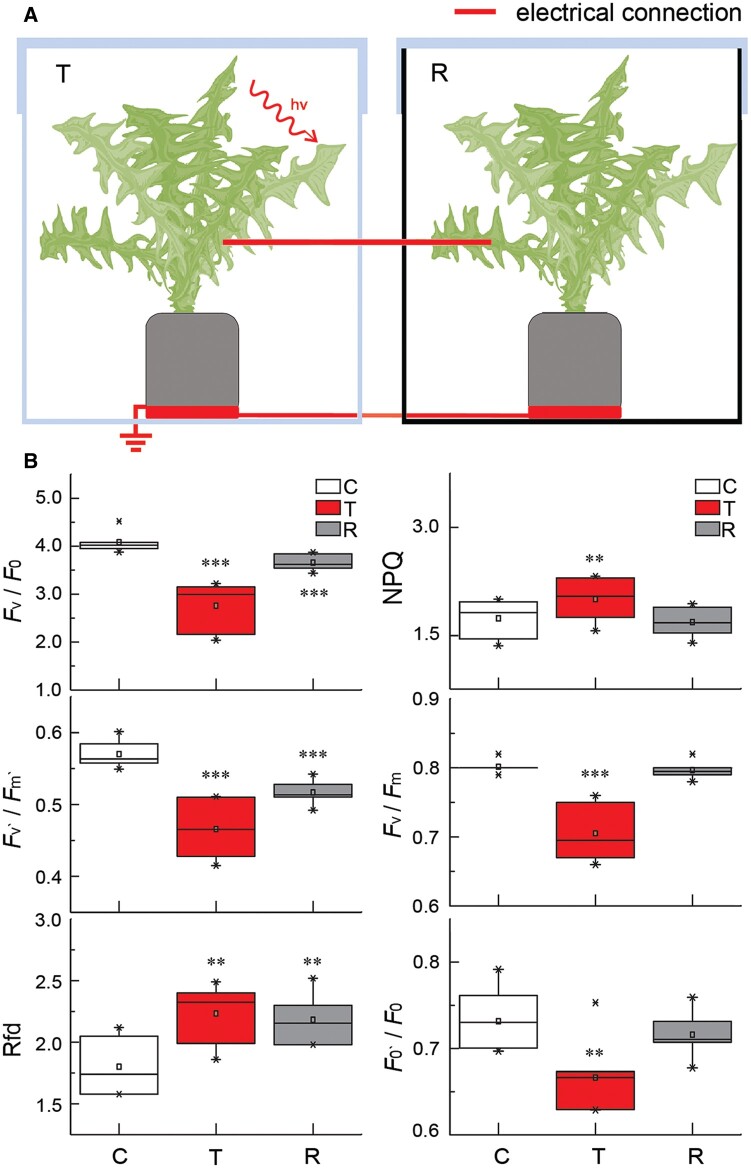
Figure 4.
Changes in Chl a fluorescence in transmitter and receiver dandelion plants connected by a copper wire. A, Schematic diagram of the experiment presented in (B). Two different dandelion plants were placed on copper discs in separate plastic boxes, one of which was transparent (T, transmitter plant), while the other box had black walls (R, receiver plant). The plants and discs were coupled by copper wires threaded through the walls of the boxes. The ends of the wires coupling the plants were attached to the main vein of the leaves, and then the plants were grown for 2 days under standard laboratory conditions. Immediately prior to the experiment, the boxes were covered with lids and sealed. The T plant was stressed with a laser pointer light (2,000 μmol photons m−2 s−1, blue 450 nm), while the R plant was untreated. B, Quantification of Chl a fluorescence parameters in C, T, and R plants: potential photosynthetic activity (Fv/F0), PSII maximum efficiency (Fv′/Fm′), Chl fluorescence decrease ratio (vitality index Rfd), NPQ, maximum quantum yield of PSII photochemistry in the dark-adapted state (Fv/Fm), fluorescence intensity ratio (F0’/F0). Control (C) are untreated plants before the experiment. ***P < 0.001; **P < 0.01; *P < 0.05, indicate significant differences between C and T as well as between C and R, as determined by Student’s t test. Data are shown as means � se (n = 10). The control experiment is presented in Supplemental Figure S10.

