Figure 4.

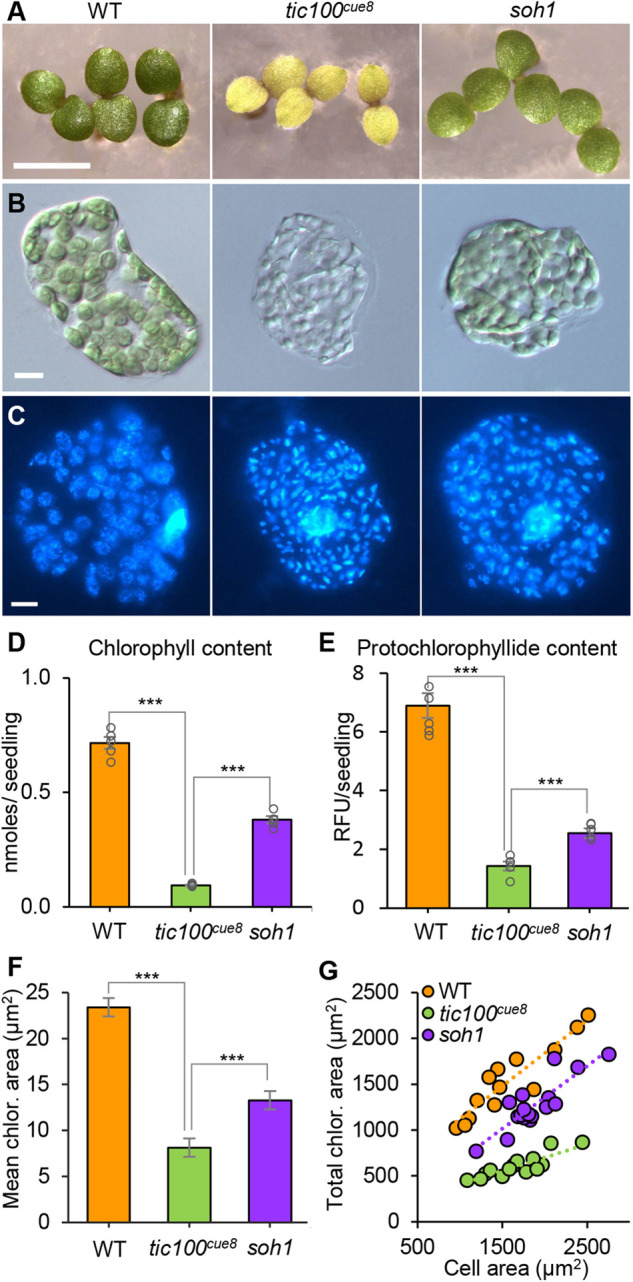
Identification of soh1, a suppressor mutant of tic100cue8, and phenotype of young cotyledon cells and their chloroplasts in WT, tic100cue8 and soh1 seedlings. A, Five-day (WT) and 6-day (tic100cue8 and soh1) seedlings. Scale bar: 5 mm. B, Individual cells of the three genotypes, of seedlings equivalent to those in (A), observed under DIC microscopy, displaying the different degrees of cell occupancy by chloroplasts. C, Individual cells observed by fluorescence microscopy following DAPI-staining of double-stranded DNA, revealing both the nuclei and the presence and density of nucleoids in individual chloroplasts. Scale bar (B and C) 10 µm. D, Chlorophyll content per seedling for seedlings identical to those in (A). E, Protochlorophyllide content per seedling (relative fluorescence units) of 5-day-old seedlings of the three genotypes. F, Mean area of individual chloroplasts in cells equivalent to those in (B). G, Total plan area of chloroplasts in a cell plotted against cell plan area, for the three genotypes, including regression lines of best fit. The presented values are means and the error bars (in D and E) show sem from five biological replicates, each with at least five seedlings, or (in F) at least 10 individual chloroplasts from each of at least 13 individual cells total, obtained from at least four different cotyledons per genotype. For all panels, asterisks above lines denote comparisons indicated by the lines: ***P < 0.001 (Student’s t test).
