
Figure 7.
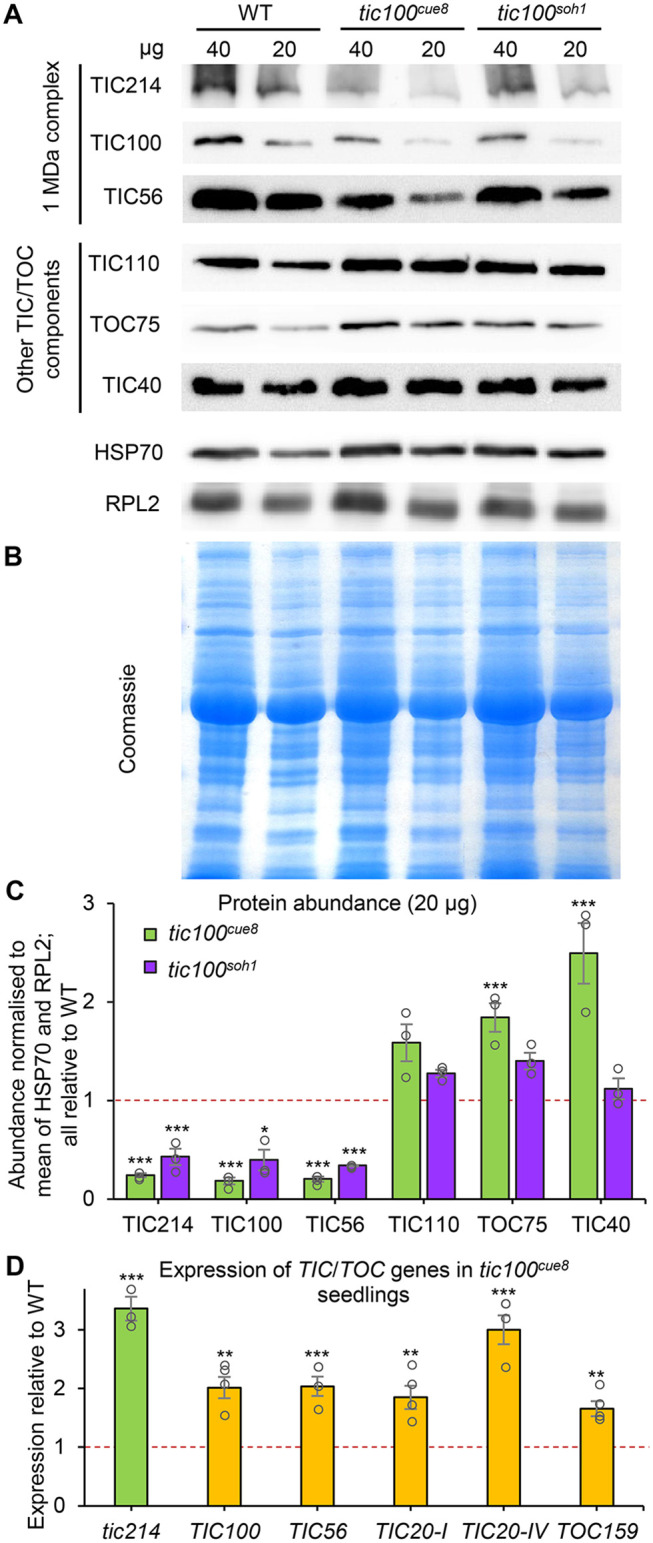
Chloroplasts of tic100cue8 display decreased levels of 1-MDa complex proteins specifically, and this defect is suppressed by the second mutation in tic100soh1. A, Immunoblot analysis of total chloroplast proteins from preparations from WT (13-day-old), and tic100cue8 and tic100soh1 (17-day-old), seedlings (see Figure 6). The amount of protein (µg) loaded is indicated above each lane. The antibodies used for the detection of components of the 1-MDa complex (TIC56, TIC100, and TIC214) or other chloroplast envelope proteins (TOC75, TIC40, and TIC110) are indicated. Note the reduced amounts of components of the 1-MDa complex, which is apparent despite the increased loading of envelope proteins (as revealed by the levels of other polypeptides) specifically in the tic100cue8 samples. Very limited antibody availability precluded probing the chloroplast protein extracts for the levels of TIC20. B, Coomassie-stained total protein gel of the same experiment. C, Quantitation of protein abundance from an analysis of the 20-µg samples in three independent experiments, relative to the mean of HSP70 and RPL2 in each sample, all expressed relative to WT protein levels. The presented values are means, and the error bars show sem. Asterisks represent significance of difference of each mutant relative to WT (Dunnett’s test). D, Expression, measured by reverse transcription-quantitative PCR, of TIC/TOC genes in tic100cue8 seedlings similar to those analyzed in Figure 3, measured relative to expression in WT seedlings. Note tic214 is chloroplast-encoded. The presented values are means, and the error bars show sem. of three RNA samples (biological replicates), each with two technical replicates. Asterisks represent significance of difference between mutant and WT: *P < 0.05, **P < 0.01, ***P < 0.001 (Student’s t test). Dotted lines represent protein levels (C) or expression (D) in WT.