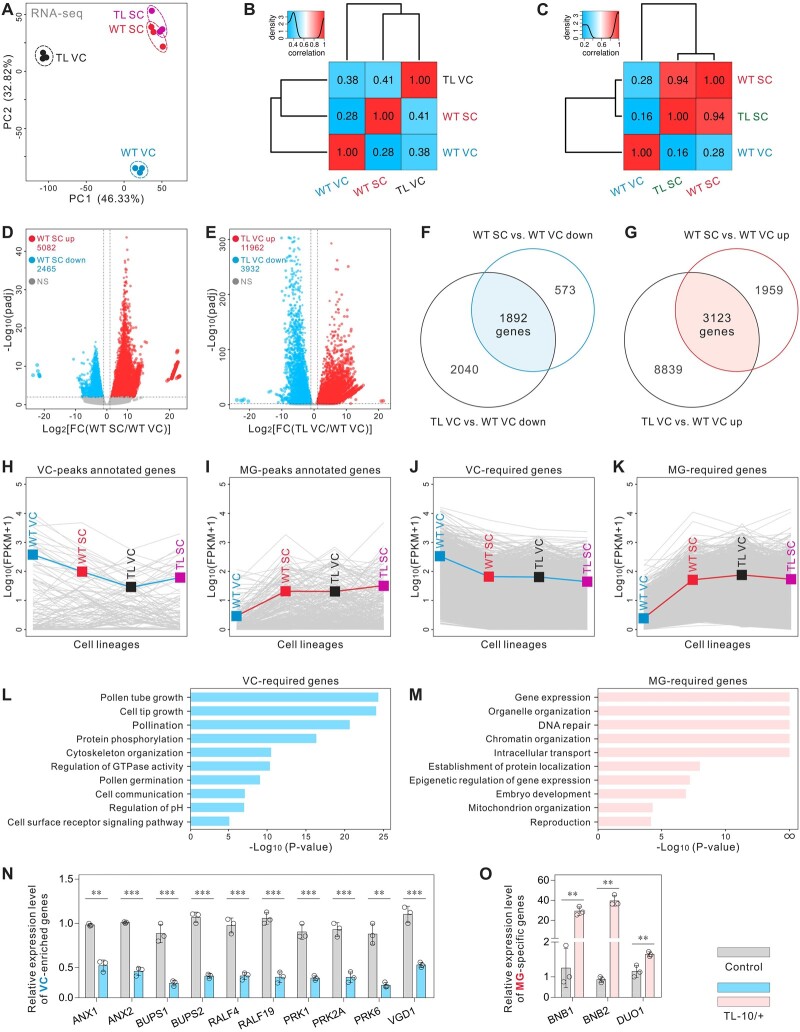
Figure 5.
H3K27me3 erasure induces transcriptome reconstruction in TL VCs. A, PCA of WT VC, WT SC, TL VC, and TL SC transcriptomes, illustrating the high reproducibility of replicates and the relationship among the four cell lineages. TL-10/+ was used in experiments. B, Pearson correlation matrix of the WT VC, WT SC, and TL VC transcriptomes shows that TL VC is more similar to WT SC, compared with WT VC. C, Pearson correlation matrix of the WT VC, WT SC, and TL SC transcriptomes shows that there is no significant difference between TL SC and WT SC. D and E, Scatterplot showing the numbers of up- and downregulated genes in WT SC versus WT VC (D) and TL VC versus WT VC (E). F and G, Overlap analysis of the down- (F) and upregulated (G) genes between WT SC versus WT VC and TL VC versus WT VC. The overlapping regions indicate VC-required genes (F) and MG-required genes (G), respectively. H and I, Expression profiles of VC-peak annotated genes (H) and MG-peak annotated genes (I) in four cell lineages, showing that TL VCs have similar characteristics to those of WT SCs at the transcriptional level. J and K, Expression profiles of VC-required genes (J) and MG-required genes (K) in four cell lineages, showing that TL VCs have similar characteristics to those of WT SCs at the transcriptional level. Blue (H, J) or red (I, K) lines indicate the mean expression levels of all genes in the different groups. L and M, GO enrichment analysis of VC-required genes (J) and MG-required genes (K) in the transcriptome. ∞ indicates P = 0. N and O, Relative expression levels of VC-enriched genes (N) and MG cell-specific genes (O) in WT and TL-10/+ pollen. Total RNA was extracted from whole mature pollen. Results are an average of three independent experiments. Statistical significance is determined by Student’s t test (**P < 0.01, ***P < 0.001) and the error bars show sd.

