Figure 6.
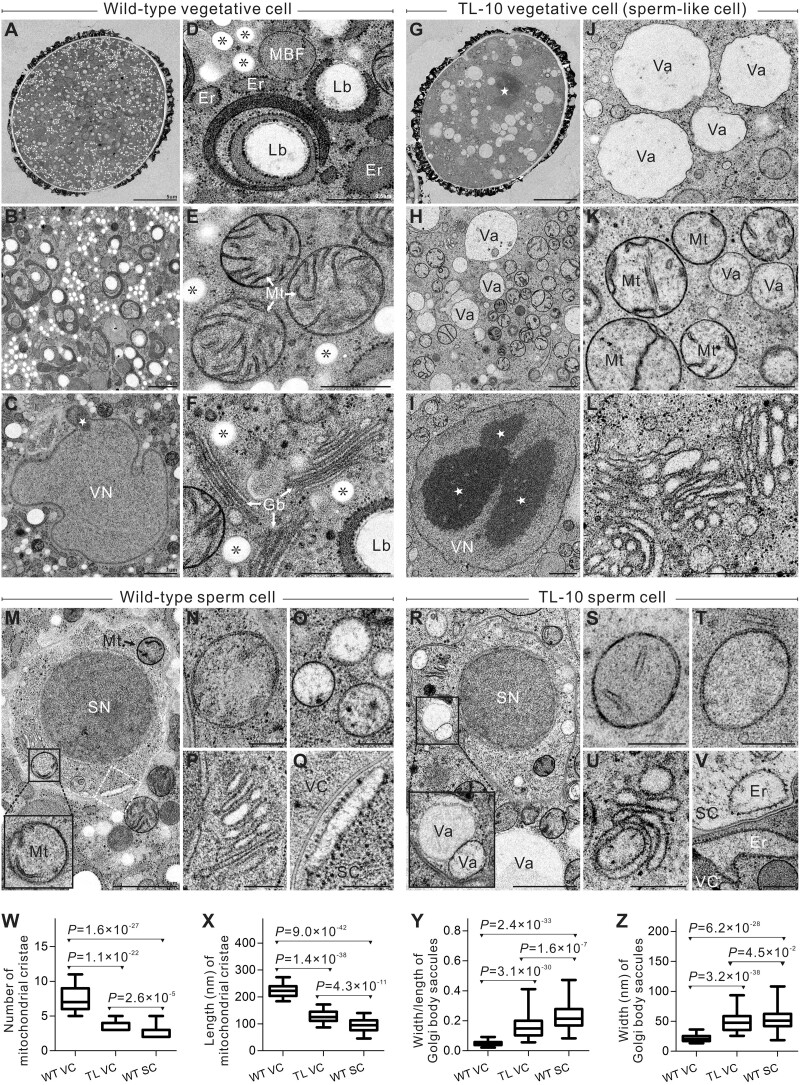
TL VCs exhibit similar ultrastructural morphology to SC. A–F, WT VC ultrastructure. A, Panoramic image of WT VC. B, Cytoplasm of WT VC displays the abundant organelles. C, Highly diffused chromatin lacking a distinct nucleolus in VN. D, Golgi vesicle, membrane-bound structures with fibrillar substance, and VC-specific lipid body. E, Mitochondria with numerous, regular-sized cristae. F, Golgi body consisting of long, narrow, stacked lamellar vesicles with small vesicles at both ends. G–L, TL-10 VC ultrastructure. G, Panoramic image of TL-10 VC. H, Cytoplasm of TL-10 VC displays the simplification of organelles. I, The giant nucleolus and compact chromatin speckles of TL-10 VN. J, Vacuoles of varying sizes. K, Mitochondria with shortened or absent cristae. L, The shortened, abnormally expanded vesicular structure in Golgi bodies. M–V, Ultrastructure of WT SCs (M–Q) and TL-10 SCs (R–V). M and R, Panoramic images display scarce organelles and highly condensed chromatin in SCs. Black boxes show mitochondria (M) and vacuoles (R) in SCs, respectively. N, S, and T, The cristae are reduced or absent in SC mitochondria. O, Small spherical vacuoles in SCs. P and U, Golgi body in SCs. Q and V, Endoplasmic reticulum in SCs. Q, Higher magnification view of the regions enclosed in white Dashed boxes in (M). W, Number analysis of the mitochondrial cristae in WT VC, TL-10 VC, and WT SC. X, Length analysis of mitochondrial cristae in WT VC, TL-10 VC, and WT SC. The average length of the cristae is the sum of all cristae divided by the number of cristae in a mitochondrion. n = 48 in WT VCs, 75 in TL VCs, and 41 in WT SCs. Y, Statistical analysis of length/width of Golgi body saccules in WT VC, TL-10 VC, and WT SC. Z, Statistical analysis of width of Golgi body saccules in WT VC, TL-10 VC, and WT SC. n = 64 in WT VCs, 119 in TL VCs, and 83 in WT SCs. Statistical significance is determined by Student’s t test (*P < 0.05, ***P < 0.001) and the error bars show sd. Scale bars, 5 μm (A, G), 1 μm (B, C, H, I, M, R), 0.5 μm (D–F, J–L), 0.2 μm (N–Q, S–V). Mt, mitochondrion; Gb, Golgi body; Er, endoplasmic reticulum; Lb, lipid body; Va, vacuole; star (⋆), highly compacted chromatin speckle and nucleolus; *, Golgi vesicle.

