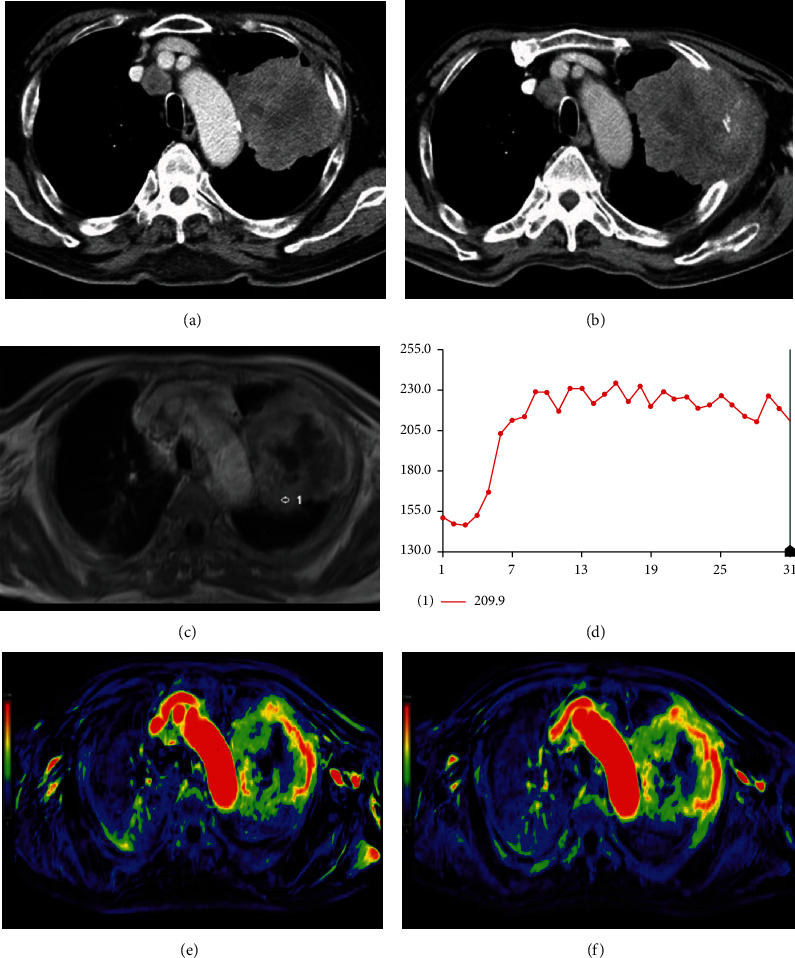
Figure 2.

Axial CT scan of a 68-year-old male with lung squamous cell carcinomas at the left upper lobe before (a) and after (b) three months of chemotherapy. At the maximum transverse dimension, about 12.0% increase of the tumor size was observed, and the patient was categorized as a nonresponder. The DCE-MRI map (c) and TIC map (d) are shown. Images of color MR PEI mapping before (e) and after (f) one week of the first course of chemotherapy showed not significant increase in tumor perfusion (the value was 914 vs. 1078).
