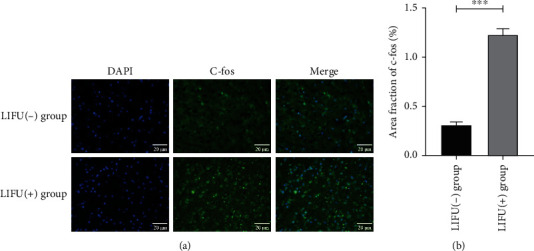
Figure 3.

Expression of c-fos (a, b) in the anterior cingulate cortex (ACC) after low-intensity focused ultrasound (LIFU) stimulation. LIFU activated neurons in the ACC (immunofluorescence (IF), ×400). Scale bar, 20 μm. ∗∗∗P < 0.0001. Each symbol represents the mean ± SEM; unpaired t-tests; n = 3 rats per assay.
