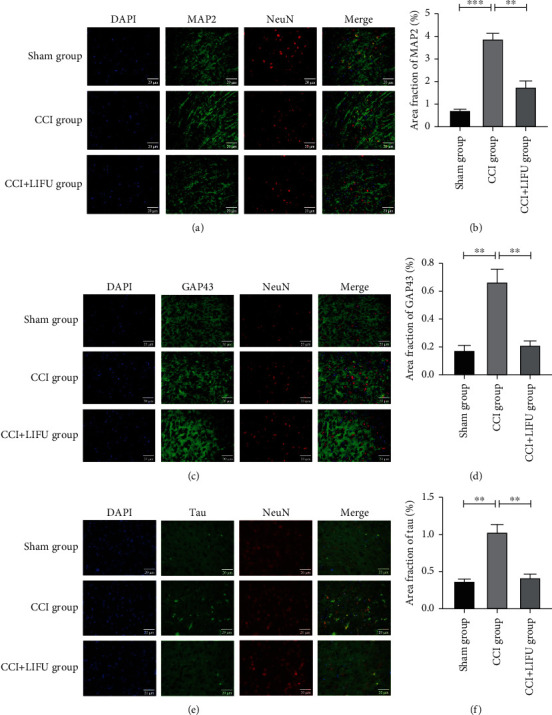
Figure 6.

Expression of MAP2 (a), GAP43 (c), and tau (e) in the ACC of mice in different groups (immunofluorescence (IF), ×400). Scale bar, 20 μm. The expression of MAP2 (b), GAP43 (d), and tau (f) in the ACC of mice in different groups after 21 days of LIFU treatment, as detected by IF. Each symbol represents the mean ± SEM; ∗P < 0.05, ∗∗P < 0.01, and∗∗∗P < 0.001. One-way ANOVA; n = 5 rats per assay.
