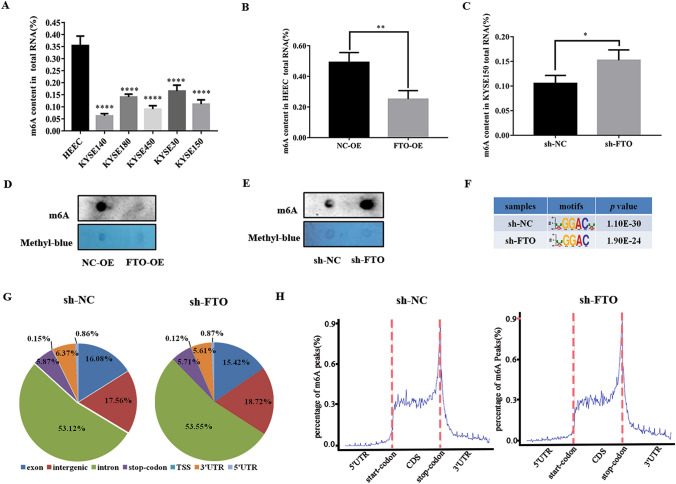
Fig. 3.
FTO regulates the level of m6A modification in ESCC cells. A The content of m6A in total mRNA in five ESCC cell lines and normal esophageal epithelial cell (HEEC) was determined by the m6A RNA methylation quantitative kit. B, C The RNA m6A content was determined with the m6A methylation kit after overexpression FTO (FTO-OE) in HEEC (B) and FTO-knockdown (sh-FTO) in KYSE150 cells (C). D, E Dot blot assay was used to analyze the methylation of m6A RNA after overexpression FTO (FTO-OE) in HEEC (D) and FTO-knockdown (sh-FTO) in KYSE150 cells (E). F Predominant consensus motif GGAC was detected in both the control and sh-FTO KYSE150 cells in m6A-seq. G Proportion of m6A peak distribution in the exon, intergenic, intron, stop-codon, transcription start site (TSS), 3′-untranslated region (3′UTR), 5′-untranslated region (5′UTR) across the entire set of mRNA transcripts. H Density distribution of m6A peaks across mRNA transcripts. Regions of the 5′UTR, coding region (CDS), and 3′UTR were split into 100 segments, the percentage of m6A peaks in each segment was determined. The data was presented as the mean ± SDs (n = 3). The two-tailed Student’s t-test and one-way ANOVA were used to perform comparison between two groups and more groups, respectively. *p < 0.05,**p < 0.01; ****p < 0.0001

