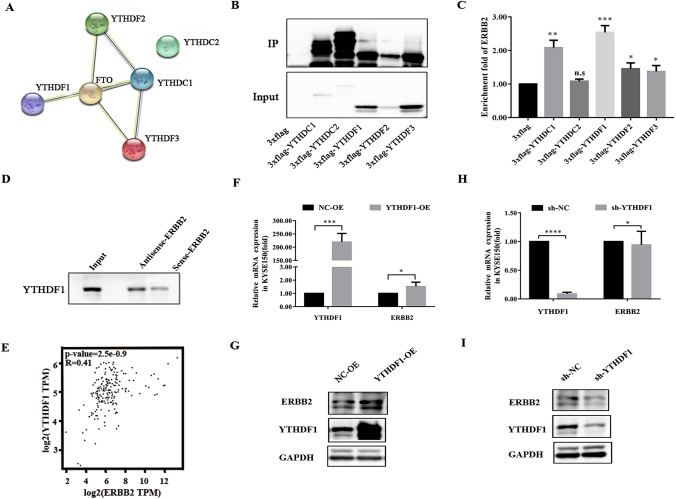
Fig. 6.
YTHDF1 preferentially decoded the m6A residue of ERBB2. A Protein–protein interaction network between FTO and m6A readers was analyzed using the STRING database. B, C Western blot (the left) and RIP-PCR (the right) were used to analyze the enrichment of 5 m6A recognition proteins in KYSE150 cells for ERBB2. The results showed that all proteins enriched the expression of ERBB2, however, ERBB2 was enriched to the greatest extent by YTHDF1. D The biotin-based pull down assays were used to further analyze the enrichment of YTHDF1 by ERBB2. The results showed a direct interaction between ERBB2 mRNA and YTHDF1. E The correlation between the expression of YTHDF1 and ERBB2 in ESCC was analyzed using GEPIA database and the results showed positive correlation. F, G The real-time PCR and the western blot analyzed showed that the expression of YTHDF1 and ERBB2 were detected in overexpression YTHDF1 (YTHDF1-OE) KYSE150 cells. H, I The real-time PCR and the western blot analyzed showed that the expression of YTHDF1 and ERBB2 were detected in knock-down YTHDF1 (sh-YTHDF1) KYSE150 cells. The result that The ERBB2 expression is related to YTHDF1 positively. The data in C, F and H was presented as the mean ± SD (n = 3). The two-tailed Student’s t-test and one-way ANOVA were used to perform comparison between two groups and more groups, respectively. n.s no statistical significance. *p < 0.05, **p < 0.01, ***p < 0.001, ****p < 0.0001

