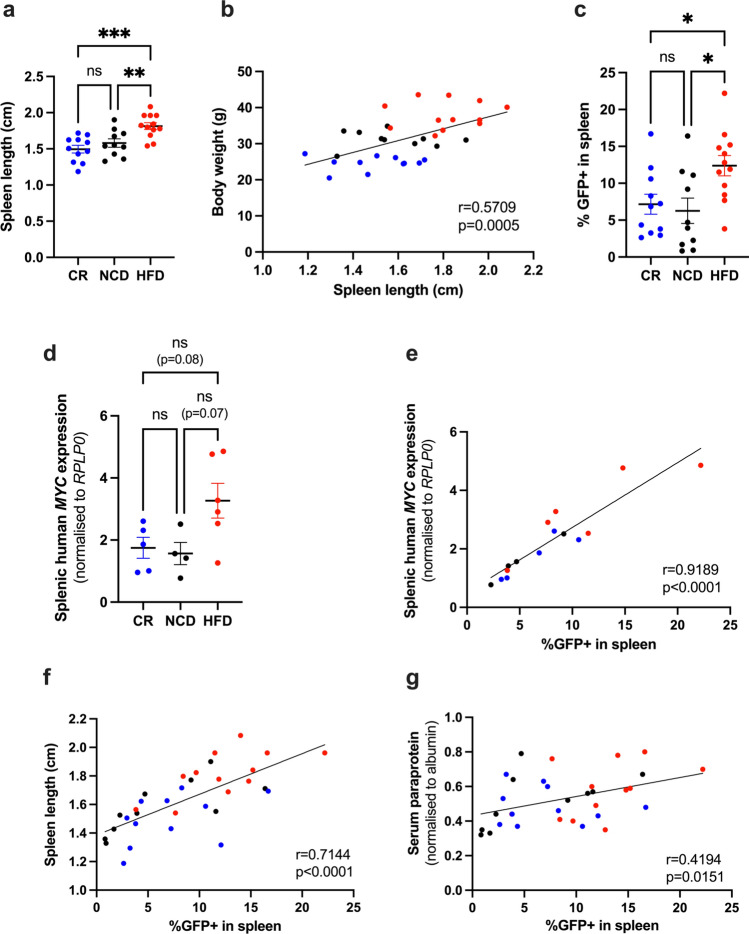
Figure 5.
HFD promotes MM tumour growth in the spleen. (a) Spleen length, (b) Correlation between spleen length and body weight, (c) %GFP+ in spleen, (d) Splenic human MYC expression, (e) Correlation between %GFP+ in spleen and splenic human MYC expression, (f) Correlation between spleen length and %GFP+ in spleen, (g) Correlation between %GFP+ in spleen and serum paraprotein. Error bars SEM, (a,c) n = 10–12 mice/group, (d) n = 4–6 mice/group, Ordinary one-way ANOVA with Tukey’s multiple comparisons test, (e) Combined data (n = 15 mice) from n = 4–6 mice/group, (f,g) Combined data (n = 33 mice) from n = 10–12 mice/group, dot colours corresponds to diet group, blue dots: CR, black dots: NCD, red dots: HFD, correlation analysis, ns p > 0.05, *p < 0.05, **p < 0.01, ***p < 0.001, ****p < 0.0001.

