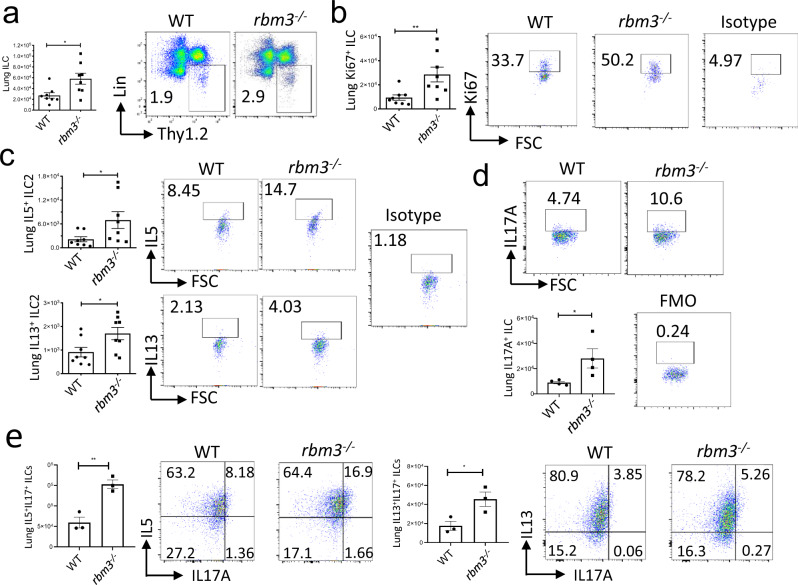
Fig. 3. ILC2s are increased in Rbm3−/− mice and show increased Th2 and IL-17 cytokine production.
Wild-type and Rbm3−/− mice were challenged with 20 µg and 10 µg Alternaria over the span of 10 days. Data shown are representative of 4 experiments (4 mice per group). a Lung Lin-T1ST2+ ILC totals (p = 0.0207) and FACS plots of Lin-Thy1.2+ population. Mann-Whitney Test, two-tailed. b Totals of Ki-67 expressing lung ILCs (p = 0.0070). FACS plots of Ki-67 percentages and an isotype control. Mann-Whitney Test, two-tailed. c Total IL5 (p = 0.0379) and IL13 (p = 0.0379) expressing lung ILCs. FACS plots of type 2 cytokines percentages and an isotype control. Mann-Whitney Test, two-tailed. Data representative of 4 mice per group. d Total IL17A-expressing ILCs (p = 0.0478) and representative FACS plots showing IL17A+ ILC percentages. Unpaired t-test, two-tailed. Data representative of 4 mice. WT and Rbm3−/− mice were challenged intranasally with 25 μg Alternaria 3 times over 7 days. (e, top) Total number and percent of ILCs producing IL5 and IL17 in WT and Rbm3−/− mice (p = 0.0053). FACS plots are representative of one experiment with 3 mice per group. (e bottom) Total number and percent of ILCs producing IL13 and IL17 in WT and Rbm3−/− mice. (p = 0.0360). FACS plots are representative of one experiment with 3 mice per group, isotype controls shown for b–e. Unpaired t-Test, two-tailed. *p < 0.05, **p < 0.01, ***p < 0.001. Data are presented as mean values+/− SEM.

