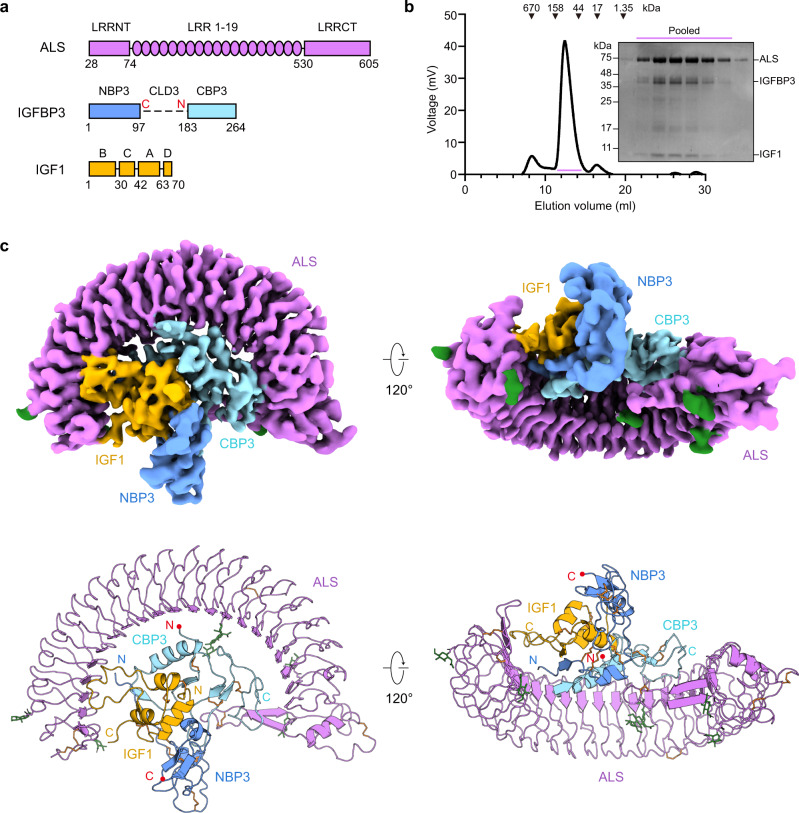
Fig. 1. Overall structure of human IGF1/IGFBP3/ALS ternary complex.
a Schematic diagram of human ALS, IGFBP3, and IGF1. Each domain is labeled above the diagram, and the amino acids are numbered under the diagram. In IGFBP3, the central linker domain, which was not resolved in the cryo-EM map, is shown as a dashed line. The boundary of the central linker domain is labeled with a red C and N, indicating the C-terminus of NBP3 and N-terminus of CBP3, respectively. b Size-exclusion chromatography (SEC) profile of human IGF1/IGFBP3/ALS ternary complex (left) and SDS-PAGE analysis of the SEC peak fractions stained with Coomassie blue (right). Pooled fractions for cryo-EM analysis are marked with the bar (violet). Similar results were observed in three independent experiments. c Overall structure of the human IGF1/IGFBP3/ALS ternary complex. Cryo-EM maps (top) and the corresponding cartoon models (bottom) of the ternary complex are shown. ALS, N-terminal domain of IGFBP3 (NBP3), C-terminal domain of IGFBP3 (CBP3), and IGF1 are in violet, blue, cyan, and yellow, respectively. The C-terminal end of NBP3 and N-terminal end of CBP3 are marked with red dots. Disulfide bridges (orange) and N-linked glycans (green) are shown as sticks.

