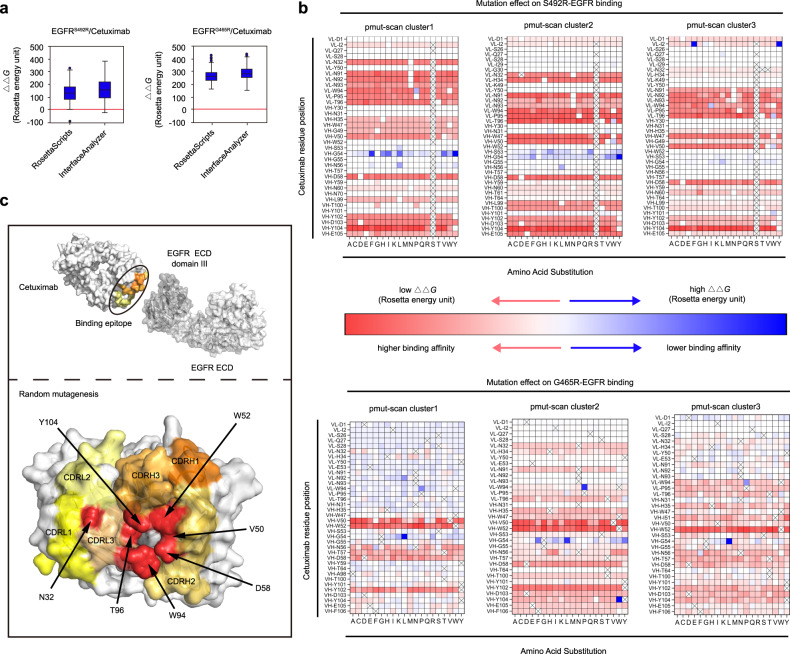
Fig. 3. In-silico identification of residues essential for restoration of cetuximab binding.
a The changes in binding energies (∆∆G) caused by the EGFR S492R or G465R mutation were analyzed by RosettaScripts and InterfaceAnalyzer (n = 100). The middle line in the boxplot displays the median, the box indicates the first and third quartile, whiskers the 1.5 interquartile range (IQR). b The ∆∆G values for the cetuximab variants in complex with EGFRS492R or EGFRG465R in three clusters (Supplementary Data 1–6). c Key amino acid residues are marked in red and shown as spheres at the interface for randomization to construct the cetuximab mutant phage-display library. Source data are provided as a Source Data file.

