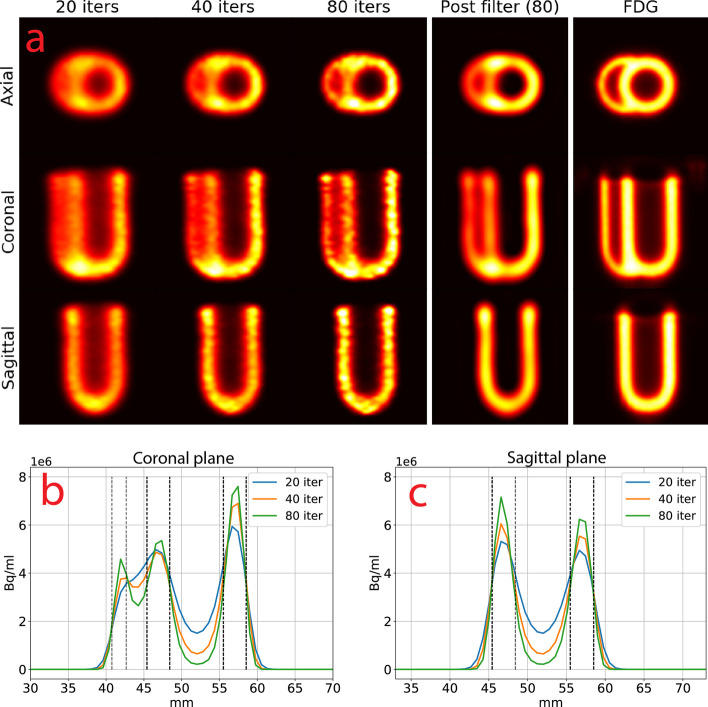
Fig. 7.
a Cardiac phantom with TDSV 41 for 20, 40 and 80 iterations, 80 iterations post-filtered with a Butterworth filter and an FDG PET scan. The images were interpolated with B- splines and shown for the same intensity window. Line profiles for the b coronal and c sagittal planes. The black lines show the placement of the right ventricular wall (leftmost) and the left ventricular walls (two to the right). Abbreviations as in Figs. 2, 3, 4, 5, 6 and 7

