
Figure 2 |.
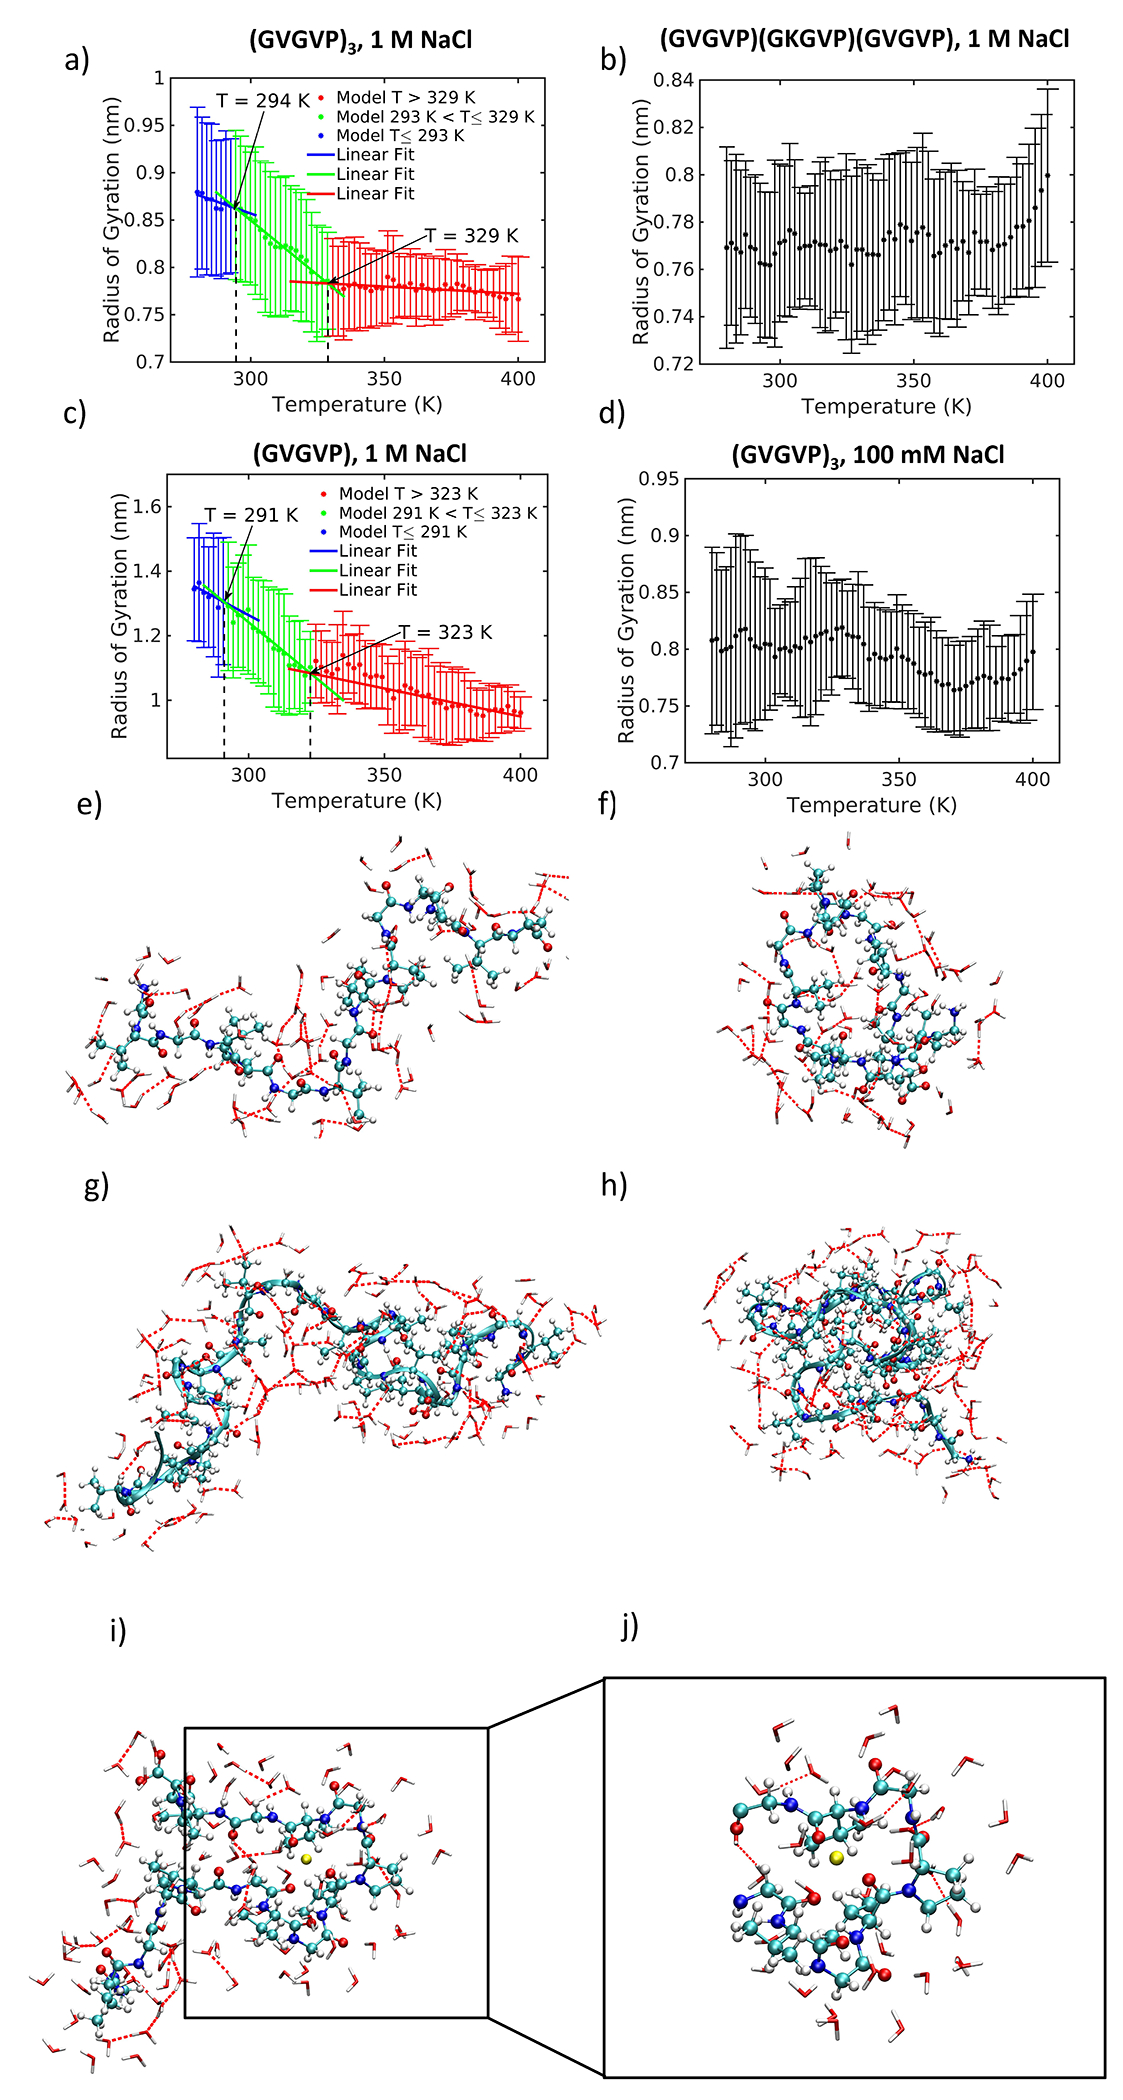
Radius of gyration change with temperature. Green represents transition region; blue represents structures below transition range; red represents structures above transition range. a) (GVGVP)3 in 1 M NaCl with snapshots at low and high temperature; b) (GVGVP)(GKGVP)(GVGVP) in 1 M NaCl; c) (GVGVP)6 in 1 M NaCl; d) (GVGVP)3 in 100 mM NaCl; e) System 1 at 280 K; f) System 1 at 340 K; g) System 3 at 280 K; h) System 3 at 340 K; i) System 1 at 340 K showing peptide, hydrogen-bonded water molecules and a single sodium ion (in yellow) within a 3 Å solvation shell; j) Expanded image showing sodium ion (in yellow) interacting with electronegative atoms of the peptide. The sodium ion is hinged on the interaction with three oxygen atoms (in red).