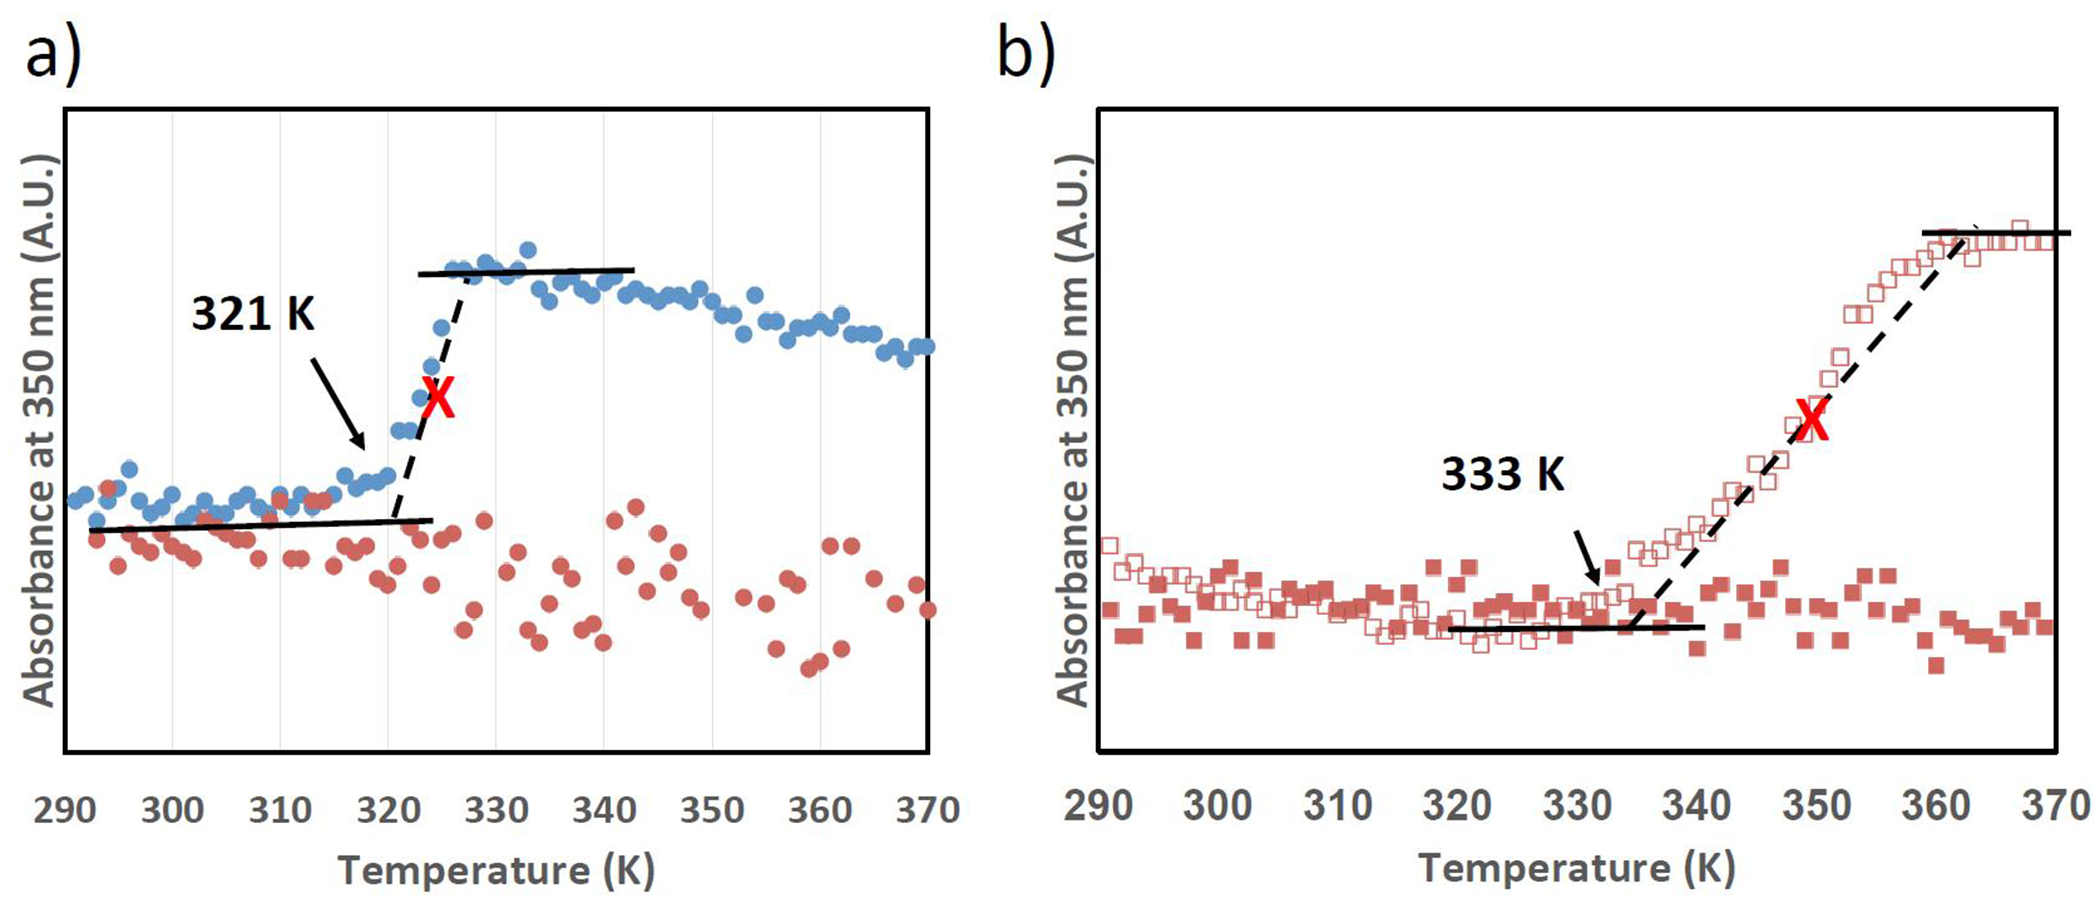
Figure 3 |.

(a) Turbidity profiles of (GVGVP)(GVGVP)(GVGVP) (blue dots) and (GVGVP)(GKGVP)(GVGVP) (orange dots) in deionized water, 60mg/ml, suggesting the transition temperature can be suppressed by switching V to K, a charged residue. (b) Turbidity profiles of (GVGVP)(GKGVP)(GVGVP) in 0.1M NaCl (orange squares) and 5M NaCl (open orange squares), 60mg/ml, suggesting the transition temperature can be lowered by increasing the ionic strength. The black arrows represent the onsets of transition, and red crosses represent the inflection point.
