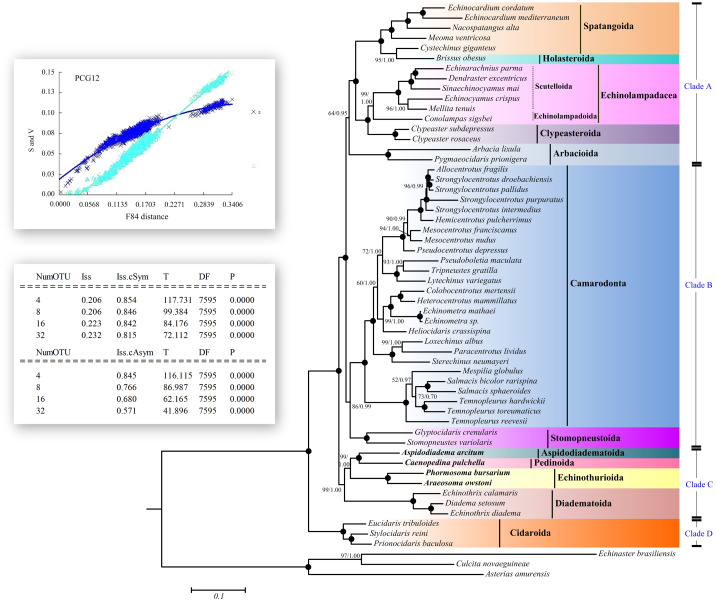
Figure 5. Saturation tests and phylogenetic trees inferred from ML and BI methods based the 12 concatenated mitochondrial genes (except atp8 gene).
The bootstrap probability (the first number) and the Bayesian posterior probability (the second number) were shown at each node. The black dots mean 100/1.00. The four echinoid species newly sequenced in the present study have been used bold taxa.

