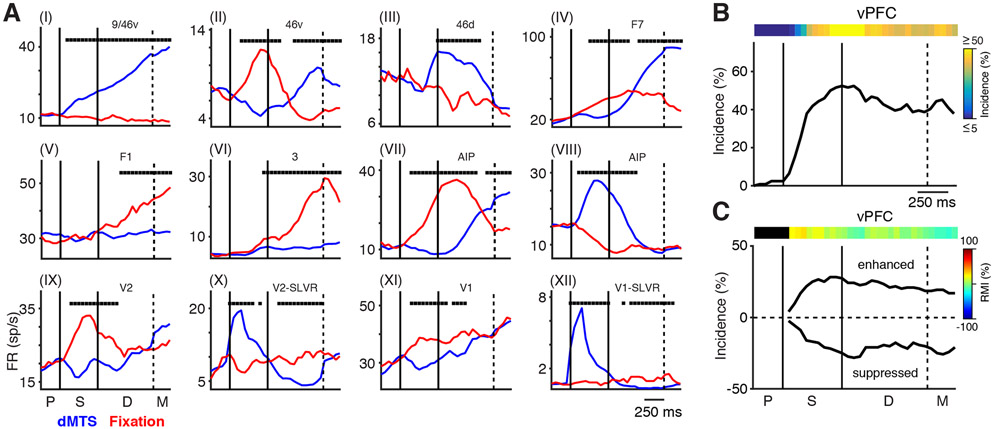
Figure 2. Task-Dependent Changes in Firing Rates.
(A) Example PSTHs from units in nine different cortical areas illustrating the average neuronal responses during the dMTS (blue) and interleaved fixation tasks (red) (I–XII). Black squares at the top of each plot indicate the timing of significant differences in firing rates between the two tasks.
(B) Incidence of significant task-dependent activity from all recordings in vPFC in both monkeys as a function of time. The colored bar at the top shows the same data as a heatmap.
(C) The same data as in (B) separated into values in which the responses to the dMTS task are greater (enhanced) or less (suppressed) than those occurring during the fixation task. The colored bar shows the heatmap of the response modulation index. There were no significant differences in the incidence of enhanced and suppressed responses in vPFC. The labels P, S, D, and M indicate the presample, sample, delay, and match locked periods, respectively, and denote the same meaning in Figures 3, 4, 5, 6, 7, and S3-S5.

