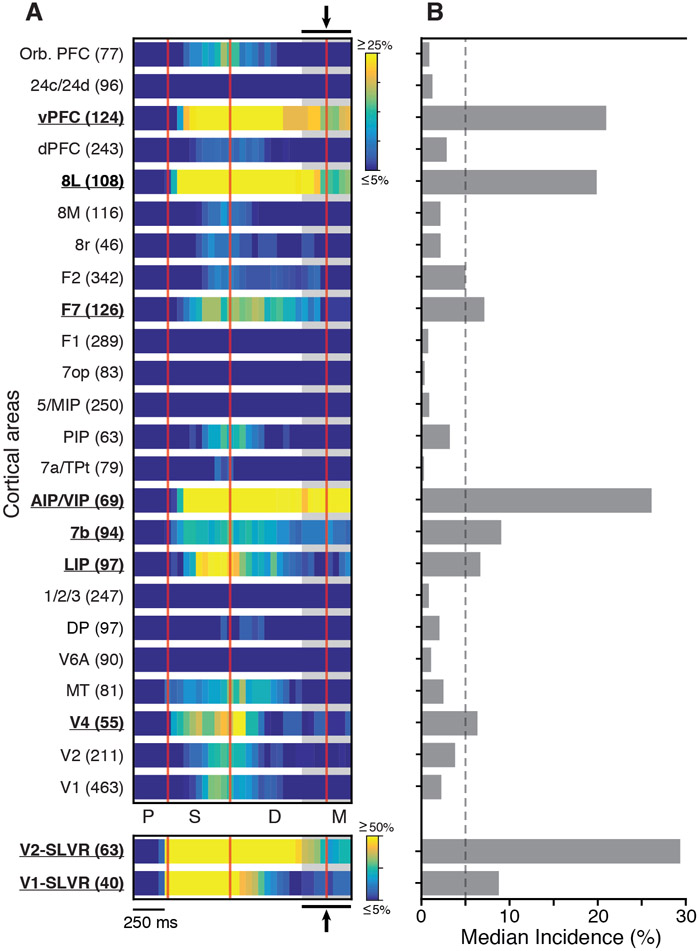
Figure 5. Distribution of Stimulus Selectivity across the Sampled Cortical Areas in Both Monkeys.
(A) Heatmaps of the incidence of significant stimulus-selective activity for each area/group over the course of the task. The bottom two plots show the data for the SLVR units in areas V1 and V2. Area/group names and number of units are shown on the left.
(B) Median incidence of stimulus selective activity during the time bins marked by the gray shaded region and arrows (top and bottom) in (A). The dashed line marks the 5% value.

