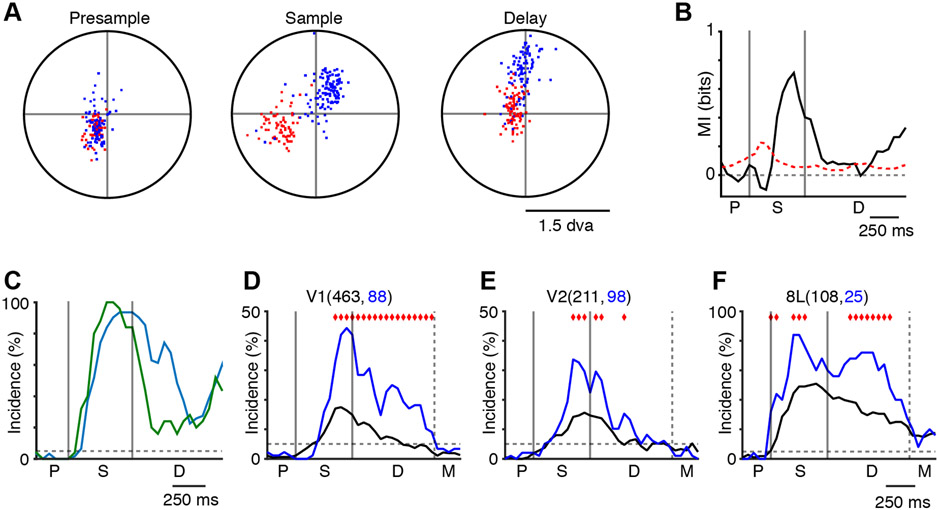
Figure 7. Microsaccades Encode the Sample Stimulus during the Delay Period.
(A) Example of microsaccade endpoints (stimulus 1, red dots; stimulus 2, blue dots) during the presample, sample, and delay period for a single recording session from monkey L.
(B) Example of the mutual information (MI) analysis (same data as A, except all five stimuli are used). The MI was bias corrected using the mean of the surrogate distribution. The red dashed line indicates the 95th percentile of the surrogate distribution (also bias corrected).
(C) Summary of the MI analysis, locked to the earliest possible match for both monkeys (monkey E, green; monkey L, blue).
(D–F) Incidence of stimulus-specific activity in V1 (D), V2 (E), and 8L (F) for the MSM units (blue) and the non-MSM units (black) over the course of the task. Red diamonds mark the bins where the incidence values are significantly different. The numbers in parentheses indicate the sample sizes.

