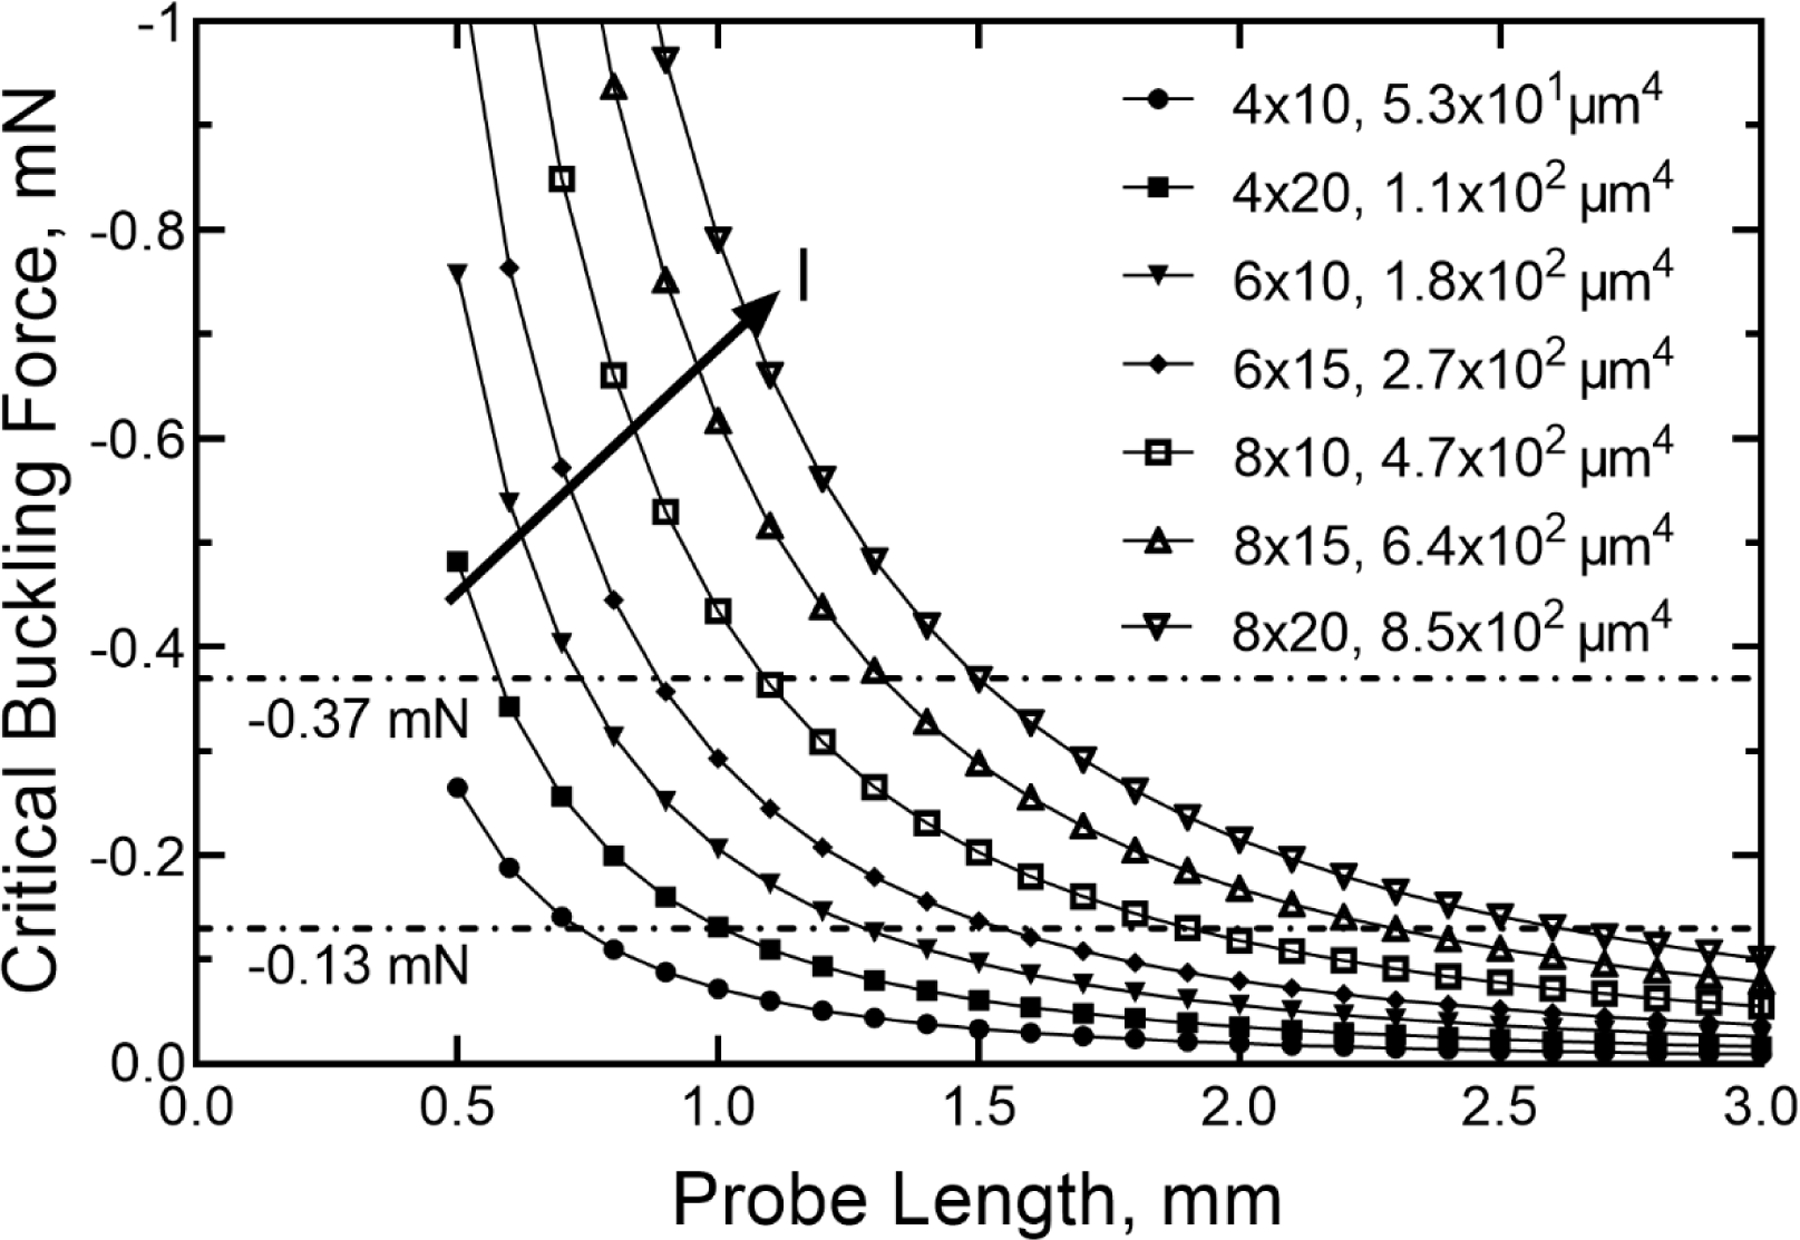
Figure 11.

Calculated critical buckling force versus probe length for a range of cross-sectional geometries with associated area moments of inertia (I). The horizontal lines indicate the average minimum compressive (−0.13 mN) and maximum compressive (−0.37 mN) cortical penetration forces measured in rat for different probe geometries. The arrow shows the direction of increasing I of the probe cross-section.
