
Figure 8.
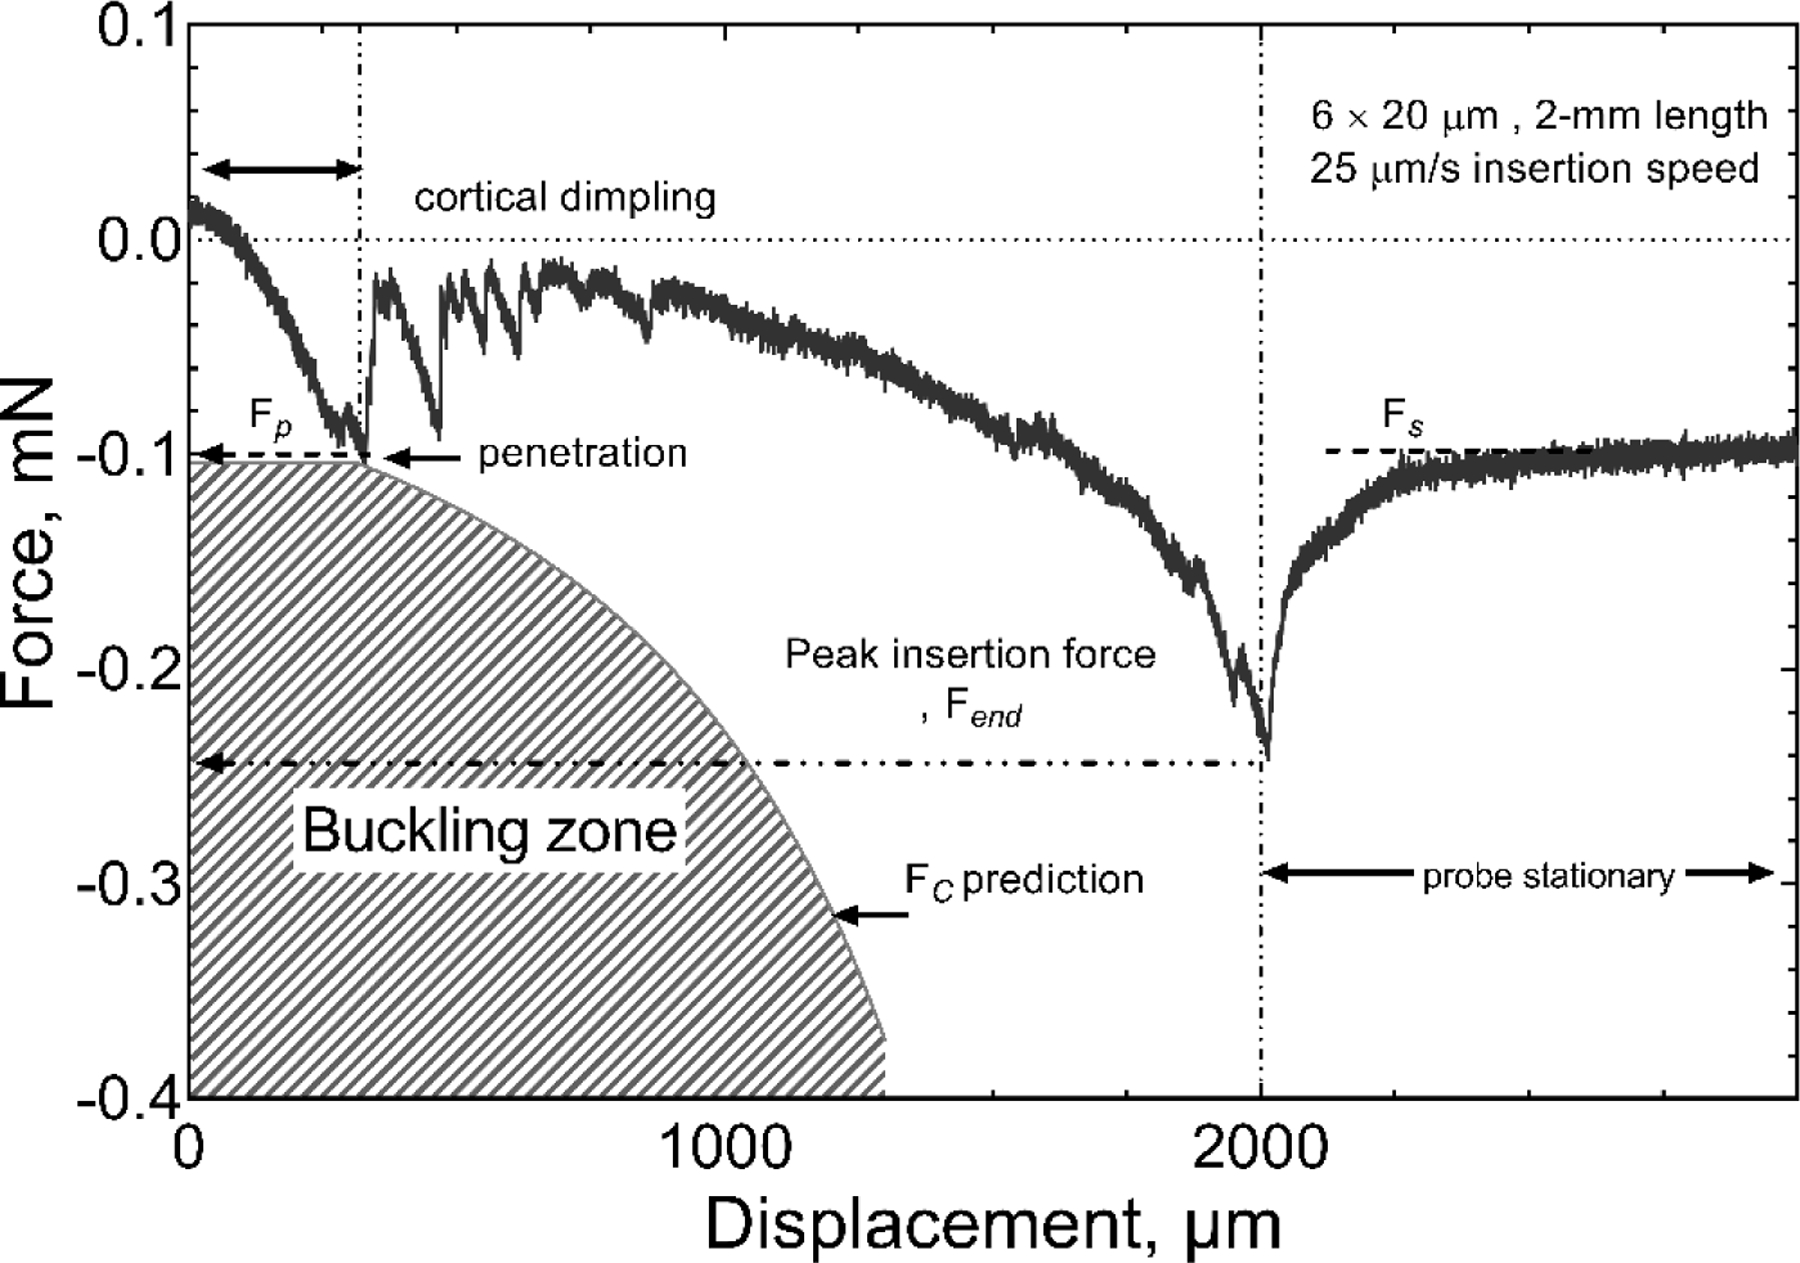
Representative force-displacement curve for insertion in rat cortex with a probe having a shank cross-section of 6 × 20 µm and length of 2 mm. The insertion speed was 25 µm/s. Fp, Fs and Fend represent the penetration force, measured force at steady state and the force measured after the full insertion, respectively.