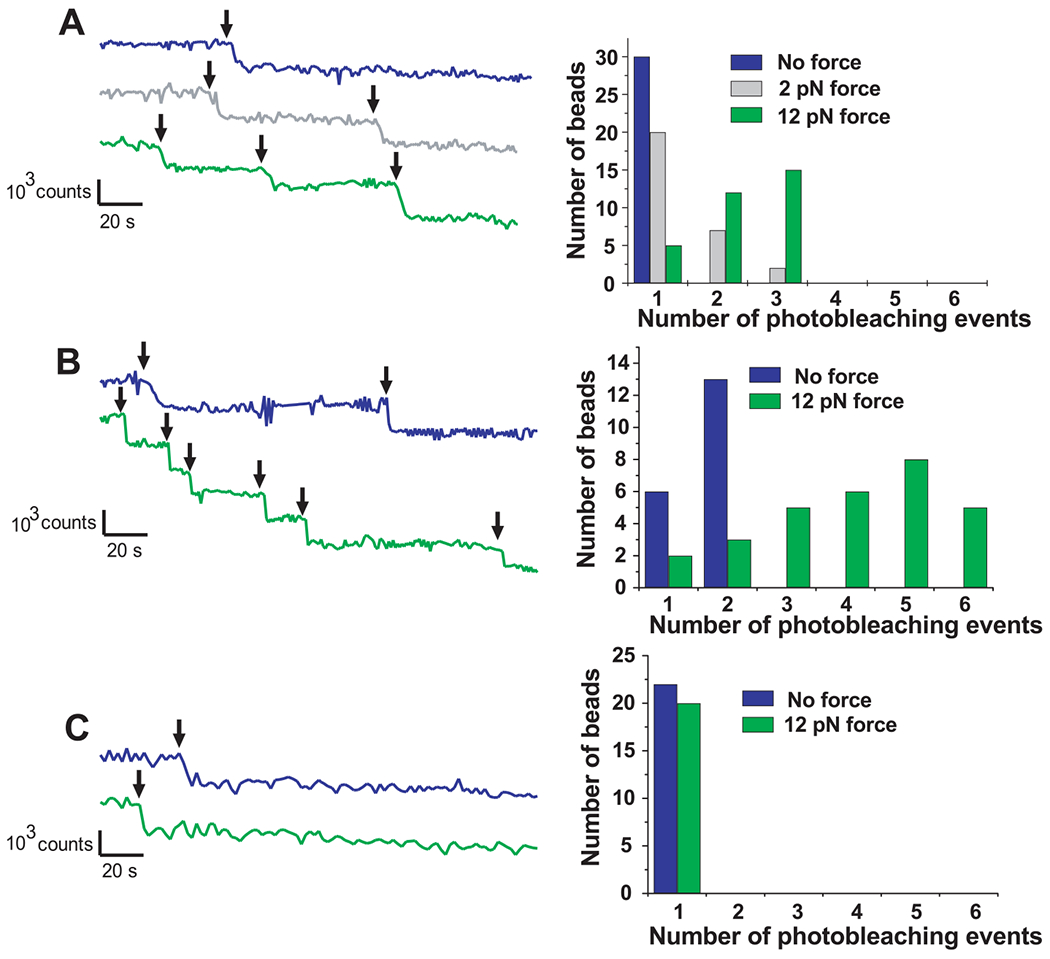
Fig. 3.

Diagram of photobleaching events of Alexa 488–Vh bound to (A) TR, (B) dimeric tandem TR, and (C) α-actinin. Histograms show the number of beads per photobleaching event. In all cases, blue, gray, and green colors correspond with no force, 2-pN force, and 12-pN force applied, respectively. The TR, talin dimeric tandem (positive control), and α-actinin (negative control) showed maximally 1 and 3, 2 and 6, and 1 and 1 photobleaching events (black arrows) when no force and 12 pN force, respectively, was applied.
