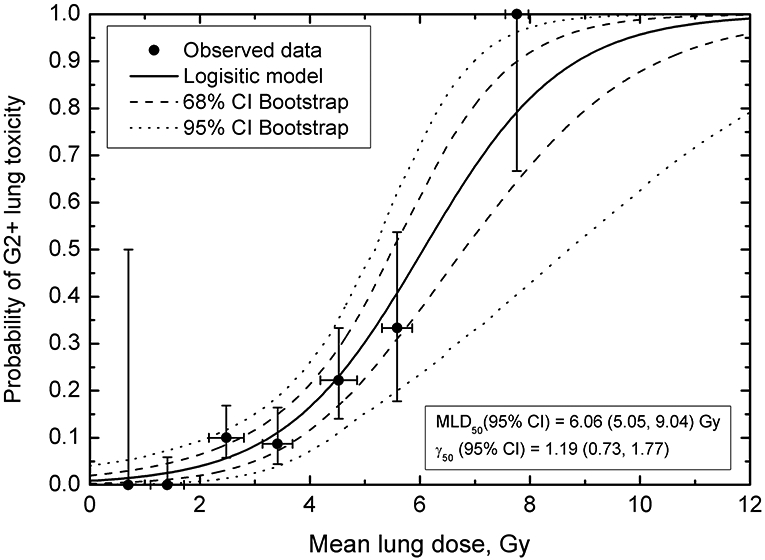
Figure 2.

Probability of Grade 2 or higher toxicity as a function of mean lung dose. Horizontal error bars on data points are standard deviation for MLD for patients in a particular MLD bin; vertical error bars are 68% binomial CI for the observed outcome. Solid line shows the logistic curve, dashed and dotted lines are confidence intervals calculated using bootstrap (68% dashed, 95% dotted). Bin size was set to 1 Gy to obtain sufficient resolution to visualize MLD-response while keeping MLD variance within the bin reasonably small.
