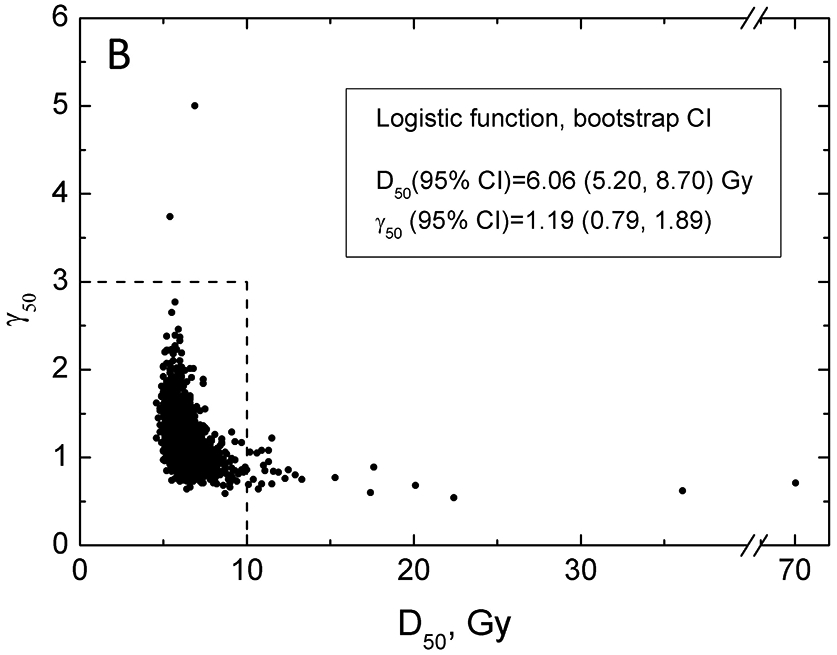
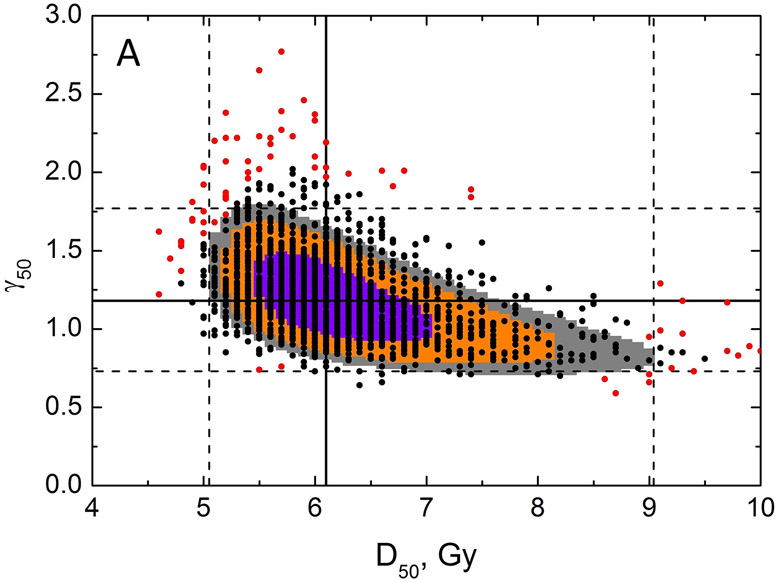
Figure 4.

Results of bootstrap analysis. Each point is D50 and γ50 calculated for a sample of patient obtained by random sampling with replacement, 2000 histories were ran. Panel A: Zoomed-in view showing a restricted range of D50 and γ50. LL areas calculated as MLL minus 0.495 (violet), 1.353 (orange) and 1.92 (grey), which are chi-square values for 1 degree of freedom divided by 2 for p=0.68, 0.90 and 0.95. Model parameter values best fitting the data are shown as black solid line, dashed lines are 95% CIs for the model parameters. The 100 red points reflect the 5% of the data which contribute the least to the CI within the MLD range 0-12Gy. Panel B: Zoomed-out view, with wider range of D50 and γ50 (dotted lines reflect the data range in panel A), with full results of bootstrap analysis. The legend shows CI for model parameters calculated using bootstrap.

