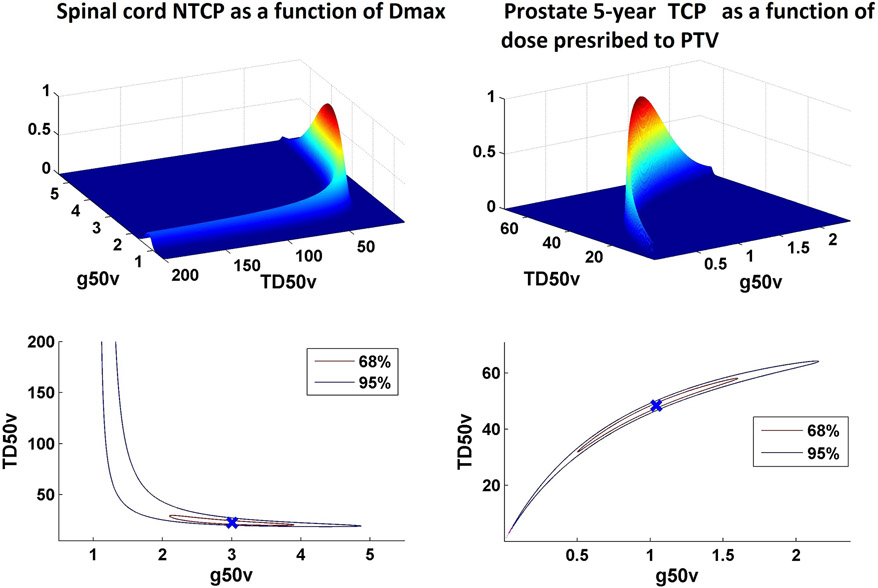
Figure 5.
Relationship of TD50 and slope parameter g50 for models based on data derived from settings were event rates are extremely low (e.g. NTCP for spinal cord as a function of Dmax in panel A) or very high (e.g. 5-year TCP for low-intermediate risk prostate cancer as a function of dose prescribed to PTV in panel B).

