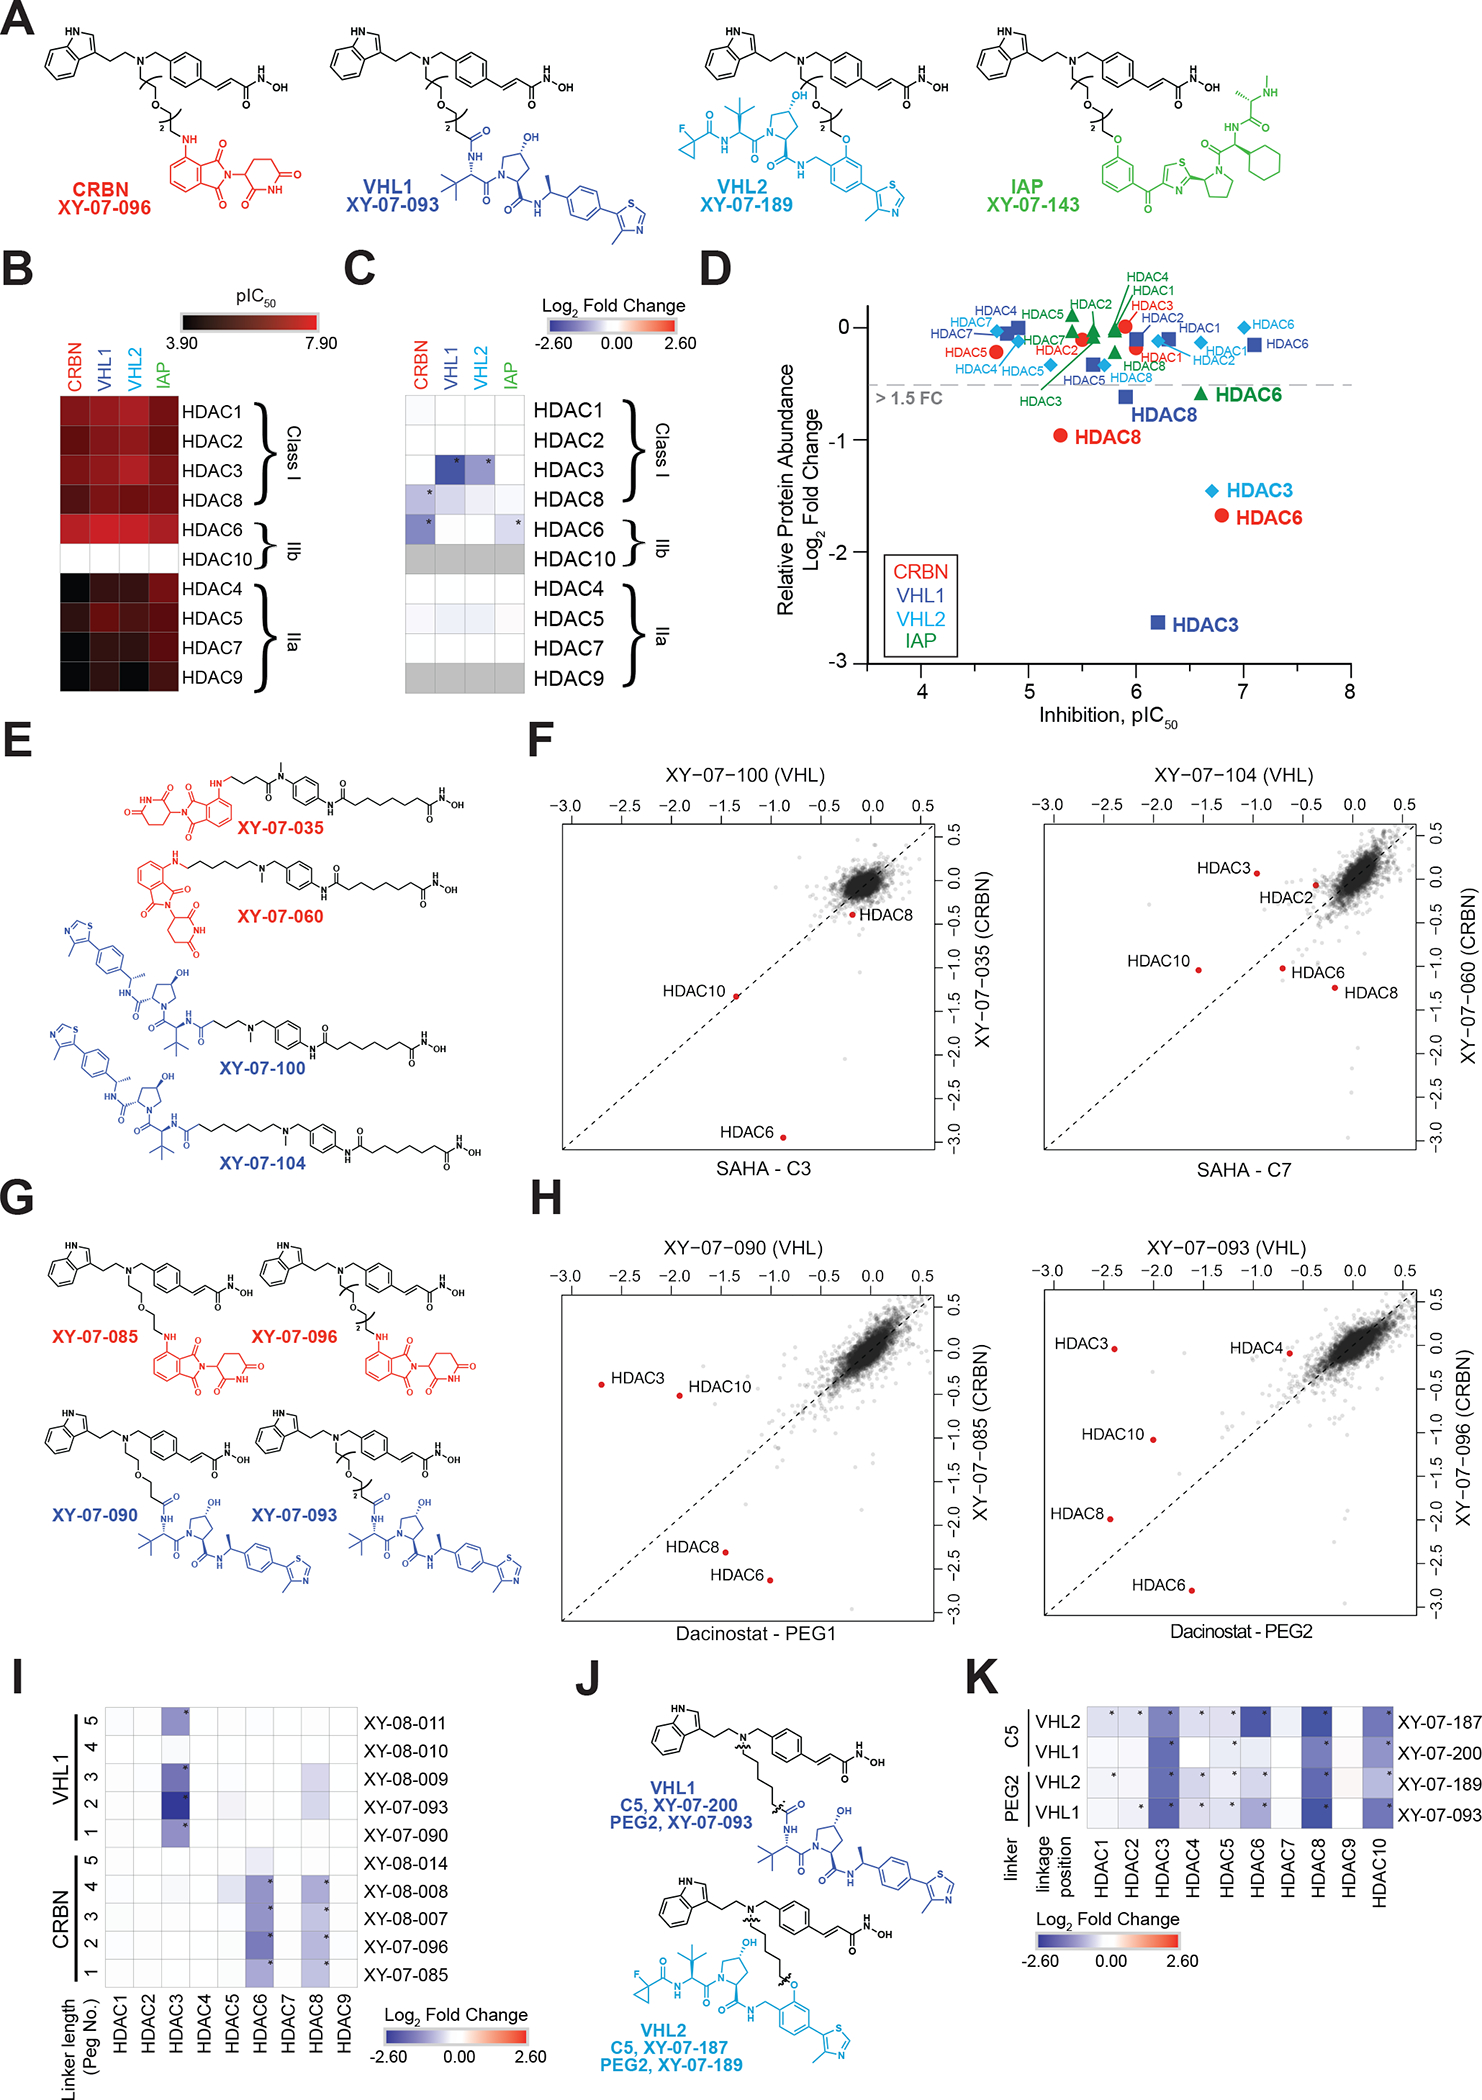
Figure 3 |. Ligase and linker influences degrader selectivity.

(A) Chemical structures for dacinostat-based CRBN/VHL1/VHL2/IAP matched series of degraders (PEG2). (B) In vitro inhibition of HDAC enzymatic activity (pIC50) for the degraders in A. Inhibition data is from n = 1 ten-point titrations. (C) Heatmap displaying the log2FC in relative abundance for quantified HDACs in response to treatment with degraders in A. (D) Scatterplot comparing HDAC engagement B with HDAC degradation C for the matched degraders in A. (E) Chemical structures for two SAHA-based CRBN/VHL1 matched pairs of degraders. (F) Scatterplot comparing HDAC degradation (log2FC) for degraders in E. (G) Chemical structures for two dacinostat-based CRBN/VHL1 matched pairs of degraders. (H) Scatterplot comparing HDAC degradation (log2FC) for degraders in G. (I) Heatmap displaying the log2FC in relative abundance for quantified HDACs in response to indicated degraders assessing linker length. (J) Chemical structures for VHL1 or VHL2-based degraders. (K) Heatmap displaying the log2FC in relative abundance for quantified HDACs in response to indicated degraders. Proteomics data is from n = 1–2 biological replicates. * on proteomics heatmaps indicates a P-value < 0.001. See also Table S2–3, Figure S1, S3, S4.
