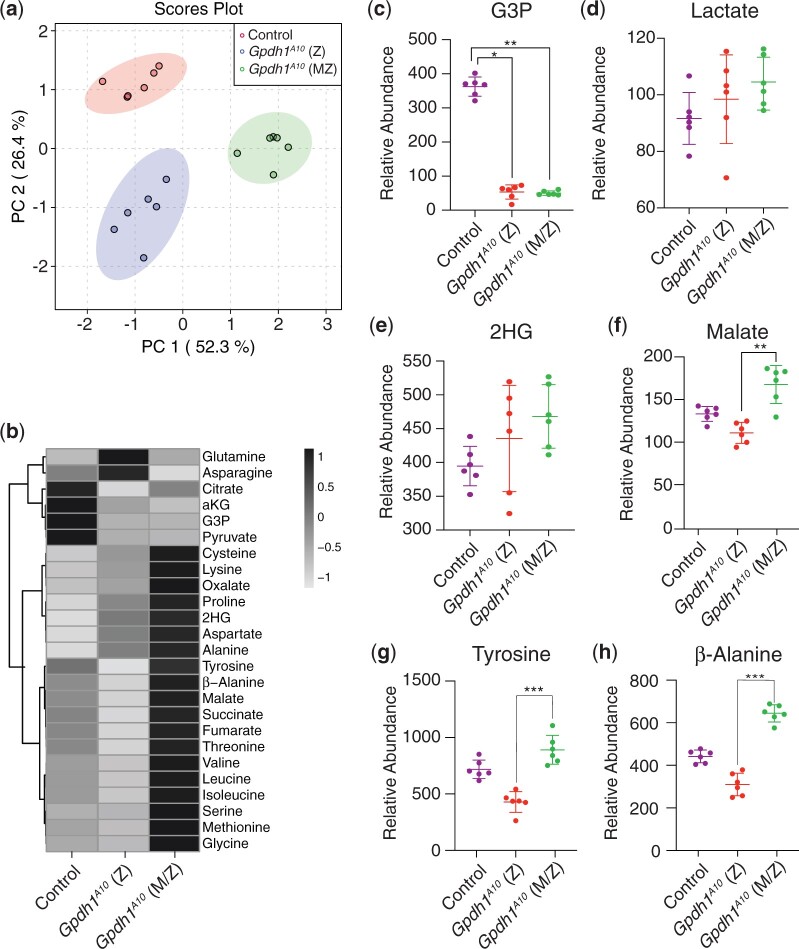
Fig. 6.
Metabolomic analysis of Gpdh1 zygotic and Gpdh1 maternal–zygotic mutants. A targeted GC–MS-based metabolomics method was used to compare the relative abundance of G3P, lactate, 2HG, and amino acids, between heterozygous Gpdh1A10/+ controls, Gpdh1A10 zygotic mutants, and Gpdh1A10 maternal–zygotic mutants. a) PCA plot showing that the control, F1 generation Gpdh1 mutants (Z), and the Gpdh1 M/Z mutant strain separate clearly in their metabolomic profile. b) Heatmap showing the increase in the relative abundance of amino acids in Gpdh1 M/Z mutants when compared to the F1 generation Gpdh1 zygotic mutants and the Gpdh1A10/+ controls. The relative abundance of c) G3P, d) lactate, e) 2HG, f) malate, g) tyrosine, and h) β-alanine are represented as scatter plots with the horizontal lines representing the mean value and standard deviation. *P < 0.05. **P < 0.01. ***P < 0.001. P-values calculated using a Kruskal–Wallis tests followed by a Dunn’s test. Analysis in a) and b) conducted using MetaboAnalyst 5.0 (see Methods).

