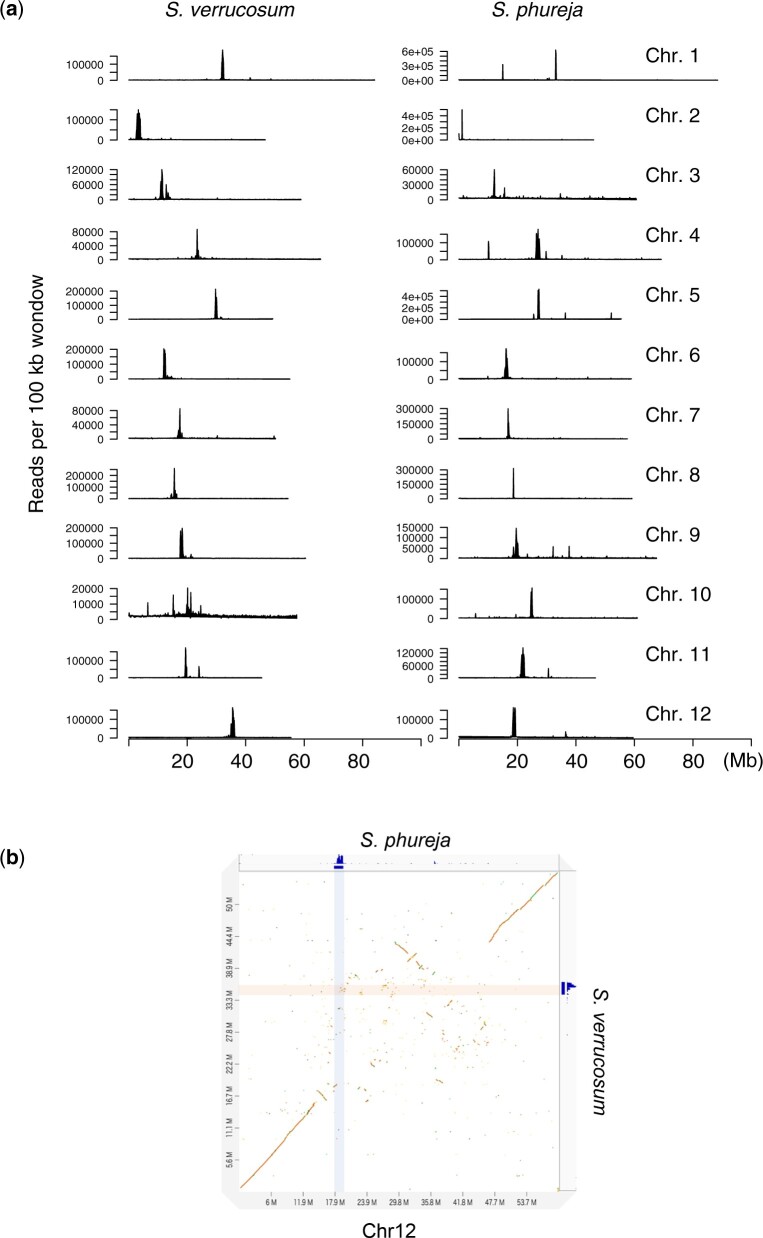
Fig. 2.
Putative centromeres. a) Distribution of CENH3 ChIP-seq signals in every 100 kb window in S. verrucosum and S. phureja. b) Dot plot between S. verrucosum and S. phureja for chromosome 12. ChIP-seq signals against the CENH3 proteins of S. verrucosum and S. phureja are shown on the right and at the top of the plot, respectively, and are highlighted on the plot.

